
Enter your business email to instantly download the guide.
Upon submission of this form, you acknowledge and accept our Privacy Policy.
Table of Contents:
- What is a NetSuite Dashboard?
- How to Create a NetSuite Dashboard
- NetSuite Dashboard Customization
- How Can Inventory Management Improve Your Business?
- Example of a NetSuite Dashboard
- What to Consider When Creating a Basic KPI Dashboard in NetSuite
Considered one of the most important parts of the Oracle NetSuite ERP platform, dashboards give users the ability to quickly get to the information they use and need most. When set up correctly, these dashboards can be customized for each organizational member or team, so they can work effectively and stay motivated, thanks to their easy-to-view metrics and objectives. This guide will break down the different parts of the dashboard and how they can be used and published for best practices within your organization.
Request More Info About Oracle NetSuite Dashboards
What is a NetSuite Dashboard?
While many may think the horizontal bar at the top of their screen is the dashboard, this is actually the NetSuite center. Your NetSuite dashboard is the home screen itself and it contains a full view of the metrics you and your teams have created within the ERP platform. It offers a snapshot of trends, reports you’re working on and their status, as well as a general overview of your function within the organization.
NetSuite dashboards can also be customized to display the details, metrics and KPIs relevant to your function, so you stay on top of your performance and management can also continue to monitor different activities.
Nonetheless, the homepage or home dashboard (accessed using the house icon) is still the best place for a NetSuite user to start their day, particularly for those who use it for client accounts. It offers the most important information updated on a daily basis so you can see where you left off as well as your clients’ status. This single source of information is displayed in what we call, “portlets”.
NetSuite Tip
Coming back to the NetSuite Center, it contains what are called center tabs, each of which is tied to a function such as Marketing, HR, etc. A good tip to ensure your teams are collaborating effectively is that they can have a dashboard within their respective function’s tab. They all have access to this published dashboard for their team’s daily progress, updates and news.
Get answers to all your basic NetSuite questions. Check out our “how-to” NetSuite videos.
How to Create a NetSuite Dashboard
Creating a dashboard in NetSuite is made up of 3 basic steps:
1. Pick a layout or format
Using the drop-down menu usually found on the upper right side, choose from the options provided.
2. Content
You should see several options and types of portlets to choose from, all of which can be added to the newly created dashboard. You can also add or remove any existing portlets using this function, found on the upper right side of your screen.
3. Setup
By hovering over the top of the portlet, you will see an option to “setup”. Use this to choose and set up the different fields that typically appear.
NetSuite Dashboard Customization
In order to customize your dashboard with relevant information for your function and team, start by looking at the content NetSuite offers. The best way to organize your dashboard is often based on roles and functions. Again, these can also be published within the home center tabs for your teams to access and view.
How can Inventory Management improve your business?
It goes without saying that effective inventory management can help save you money. In fact, we’ve already written about the top tips that can help maximize your savings with efficient inventory management. But here are the benefits provided to you from NetSuite’s Inventory Cloud solution:
Customer Churn Rate (CCR)
CCR = number of customers churned - (customers who joined and churned) - (customer who churned & returned) in the defined period / number of customers at start of period.
Monthly Recurring Revenue (MRR)
Gross MRR = (Churned MRR + Downgrade MRR / MRR at the end of the previous month) * 100
Net MRR = (Churned MRR + Downgrade MRR – Expansion MRR) / MRR at end of last month
Annual Run Rate (ARR)
ARR = revenue in period X * Number of periods of X in 1 year
Customer Retention Rate (CRR)
CRR = [(number of total customers at end of period X - number of new customers added within period X) / number of existing customers at start of period X] * 100
In addition to churn specific KPIs, subscription-based companies further analyze the state of their customer base by calculating periodic and long term value and cost to get a fuller picture of the health of their business.
Popular SaaS KPIs to consider include Customer Lifetime Value, Customer Acquisition Cost, CAC:LTV Ratio, Net Promoter Score, Payback Period, Annual Contract Value, among others…
These are the basic options NetSuite offers when customizing your dashboard:
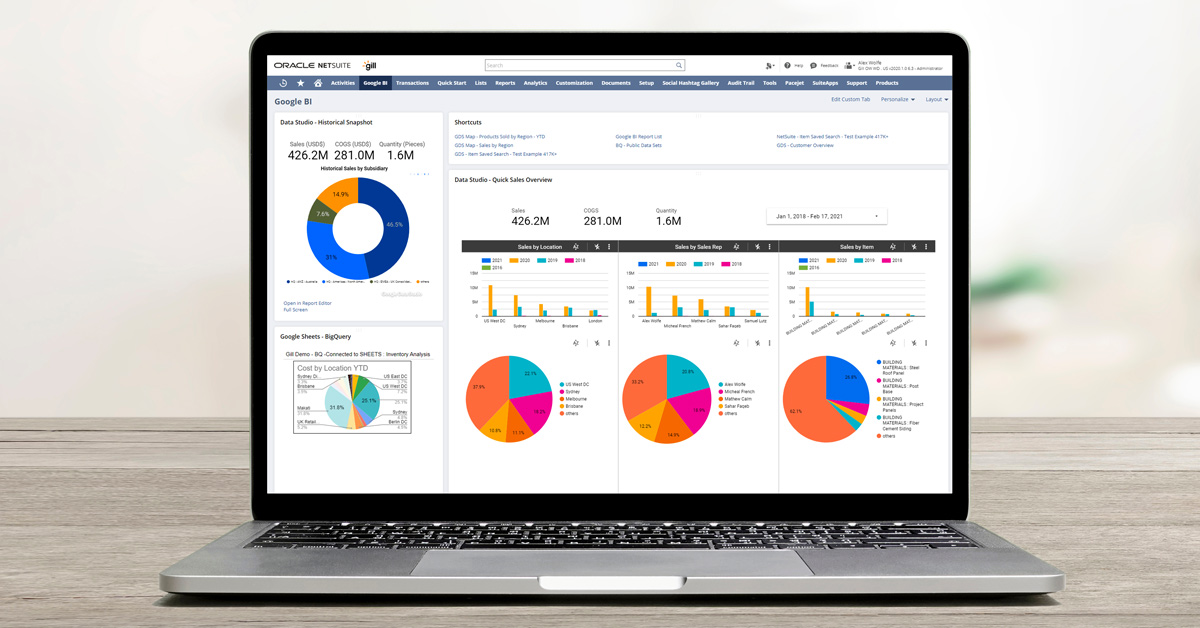
- Analytics dashboard
- Key performance indicators (KPI) - as a meter with a gauge as well as in scorecard view with graphic indicators for an overall view
- Portlets
- Custom searches for a specific function or role
- Graphs depicting trends, often used in sales-related roles
There’s more to it than just creating the dashboard, it also requires updating and maintenance to ensure it stays relevant to the job functions and objectives, which could change periodically. That’s why it’s important to team up with the right ERP implementation partner. This will ensure your full NetSuite setup is done correctly and can be added onto, if needed.
Example of a NetSuite Dashboard
While NetSuite clearly offers enough dashboard options to choose from in almost any industry, what is often found to be the most important to management and business owners is the KPIs. Again, these can be viewed as a meter, which is a visual gauge of where you are with respect to your objectives. They can also be depicted as graphs, which gives a more comparative view using colors and bars to show differences. For this dashboard example exercise, let’s look at KPIs, in general.
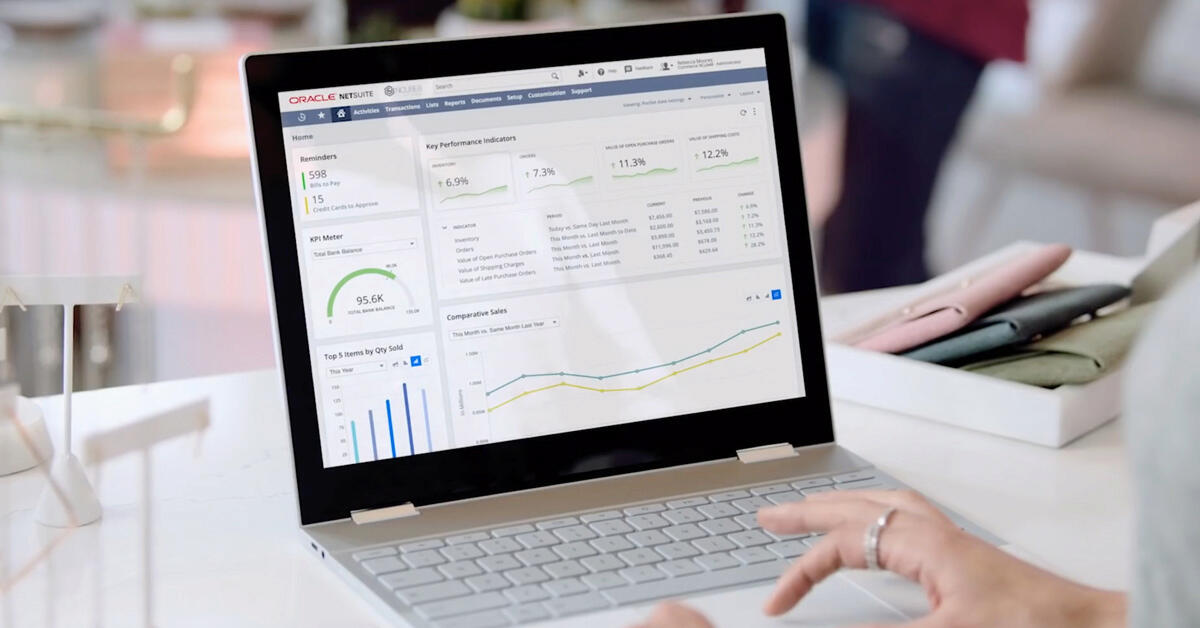
KPIs in a NetSuite Dashboard
Key Performance Indicators (KPIs) are often used for more goal-oriented NetSuite dashboards and can be set up in the format of your choice, as we just saw. Those in a customer-facing role, such as customer experience or sales, can use these metrics to maintain a full view of their ongoing performance.
This lets the employee see the objectives created specifically for them and not for the entire organization, which is important for their personal performance reviews as well. They still can view those of the organization and use them as a benchmark of where they are in helping to achieve them.
Similarly, managers can obtain access to these dashboards to ensure their employees and the organization are meeting service standards. This also gives company management access to their teams’ performance, which they can monitor as needed. Again, this can be a highly motivating and telling tool for the different parts of the organization.
What to Consider When Creating a Basic KPI Dashboard in NetSuite
Not all KPI dashboards will include the same metrics. It all depends on the organization and the teams or employees within it that will be using this dashboard. That said, there are certain factors to consider when creating your KPI focused dashboard in NetSuite.
Here are the basic factors that could help you decide what is relevant to your organization and its functions:
The dashboard’s main users
For simplicity, it’s usually best to name a dashboard after its function or role. So, while a sales dashboard may be published and shared with other teams, it would be strictly for the sales team’s use. They would use it to view and measure their sales objectives and where they are (personally and as a team) in reaching them. A constant and real-time view of this can help sales teams track their activities and decide what tactics are working best - or not.
Build SMART KPIs
It may seem obvious but it’s still worth mentioning that KPIs should be relevant to a job function or team. They should be directly related to the business’ goals for this team and each of its members. This shows progress and areas needing improvement. A common approach is the SMART one: goals that are specific, measurable, achievable, relevant, and time-sensitive. In applying this technique, employees are clear on what is expected of them as it’s also constantly visible to them on their main page. This also lets managers tweak or amend their objectives using the timing aspect of the SMART approach. Again, another area where the real-time updates come into great use!
Use automatic updates for your dashboard
It’s no surprise that manually inputting data runs the risk of human error and can create unwanted delays. That’s why it’s important to have automatic updates that come from other objectives and factors within the same ERP platform to build out the full KPI dashboard. If the sales team relies on daily updates to gauge current sales and performance, a potential mistake or delay in uploading these details to the dashboard could be harmful to their performance.
Setting up your NetSuite dashboards is an important step towards staying efficient and productive. It helps you and your team create objectives, see current metrics on various activities as well as share important client information, depending on your industry.
This is why it’s important to work with a NetSuite Consultant, who can help with the implementation as well as train your teams for their own future NetSuite use.
To learn more on how GURUS Solutions can help you with your Data Visualization challenges, book a demo to see our BI4NetSuite tool in action.
