Webinar Overview
This quick 30-minute webinar will showcase the important features of business intelligence for NetSuite ERP newcomers, such as:
|
|
What is Business Intelligence (BI)? |
|
|
Evaluating your readiness for BI |
|
|
GURUS BI 360 Product Demo |
|
|
Understanding the NetSuite Use Case |
|
|
GURUS BI Live Demo |
Want to learn more about GURUS Products for NetSuite?
 |
 |
What is business intelligence (BI)?
The purpose of business intelligence is to support better business decisions and refers to technologies, applications and practices for the collection, integration, and analysis of business information.
While reporting shows you what has happened so far business intelligence shows you why things happened and how to improve business performance in the future. Using multiple sources of data, BI lets you discover data relationships you never knew existed and explore new business possibilities.
Evaluating your readiness for BI
To best understand whether or not business intelligence is right for your business, take a look at the model below from TDWI, the industry leader in BI and data warehouse.
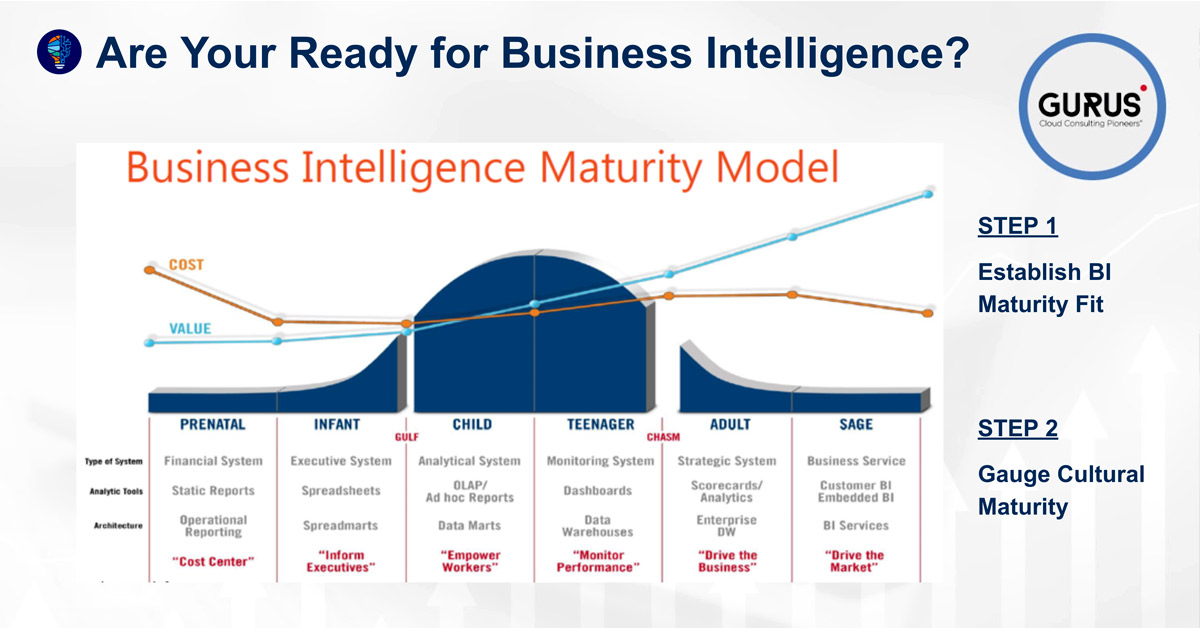
By establishing their position within the curve, organizations can figure out where they stand in terms of reporting and analytics. For example, organizations that are just starting out will be more focused on reactive reporting: they understand the need for reporting, know the value it brings, and are analyzing it daily.
On the other hand, the more an organization matures, the deeper reporting analysis is required as they manage operations across multiple systems. Most organizations are anywhere between an “infant” or “child” on the model, where there is a lot of ad hoc reporting and therefore a higher need for BI analysis.
Once you’ve determined your organization’s business maturity, you can move onto step 2, which is about gauging your cultural maturity. In other words, looking at BI reporting and analytics as a technology.
This is where you’ll level up and fall under the “adult” or “sage” stage. BI is part of your business culture with a governance in place.
The two lines on the model show you the cross section between cost and value. If you’re not quite there yet and don’t have a reporting system in place, BI is not the place to begin. Your organization must have some sense of maturity in growth to see the value of a BI technology.
It’s important to know that this “maturity scale” doesn’t depend on the size of your organization. In fact, smaller organizations also see the importance of BI. There’s no need to be a massive corporation to understand the true value of business intelligence.
To determine whether your business is ready for business intelligence, ask yourself the following questions:
- Are the reporting and analytics challenges limited to a few use cases? Or are the problems more pervasive across the company?
- Does the current ERP system house most of your reporting data? Or does it need to mine other systems and data sets?
- Who are the primary stakeholders? Is it Operations? The Executive Team? Both?
- Is the team addressing time-sensitive operational reporting? Or more “Big Picture” forecasting insights? And what is the strategic nature of this information?
- What is the volume of data that needs to be mined?
- Is reporting primarily for internal purposes? Or does the information need to be shared and collaborated with external partners and customers?
GURUS BI 360 Product Demo
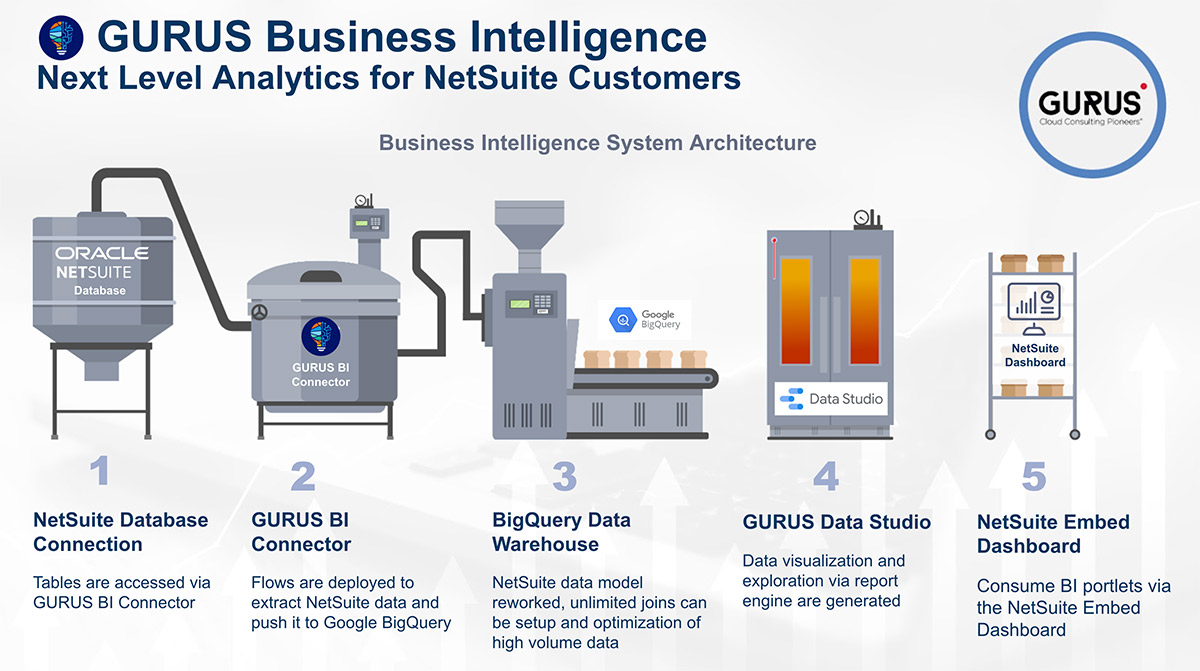
GURUS Business Intelligence is a technological solution designed specifically for the NetSuite world. After 16 years of experience in the industry, the team at GURUS took the NetSuite data schema and built out a very powerful data model, so the end user could easily generate reports for their organization.
With GURUS BI, you will have the ultimate powerhouse of analytics built exclusively for the NetSuite customer. The raw data tables from NetSuite alongside our own proprietary connector pulls all data and reports into a data warehouse, Google BigQuery.
Our NetSuite data model is in house and part of the solution provided by Google Data Studio, which is the visualization tool that's part of the Google stack and comes for free. It's out of the box and provides you with templates where you also have the ability to take information and embed it right back into NetSuite.
Data Studio
Data Studio is a powerful system that allows users to have accessibility to dynamic visualization tools like pie charts and diagrams all within a customizable dashboard.
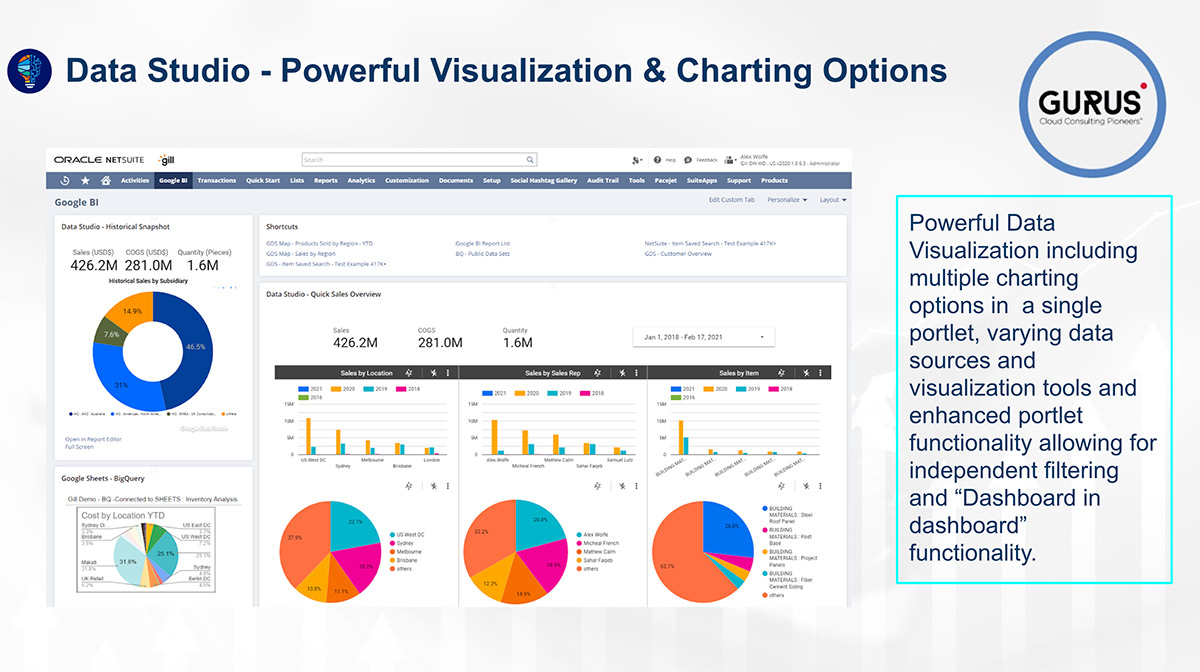
Users will also have access to timeline drilling. If you’d like to do a time series, you can filter through information to pinpoint data sources, records, and transactions for strategic decision making.
These transactions are fully embedded within your NetSuite environment, where you can click on any of the hyperlinks and get directed to the actual record or transaction right within NetSuite.
Another area that is rather interesting is the limitations around saved searches supporting high volume data sets. Quickly generate high volume data sets in a visualization table and/or chart regardless of joins, filters or number of records.
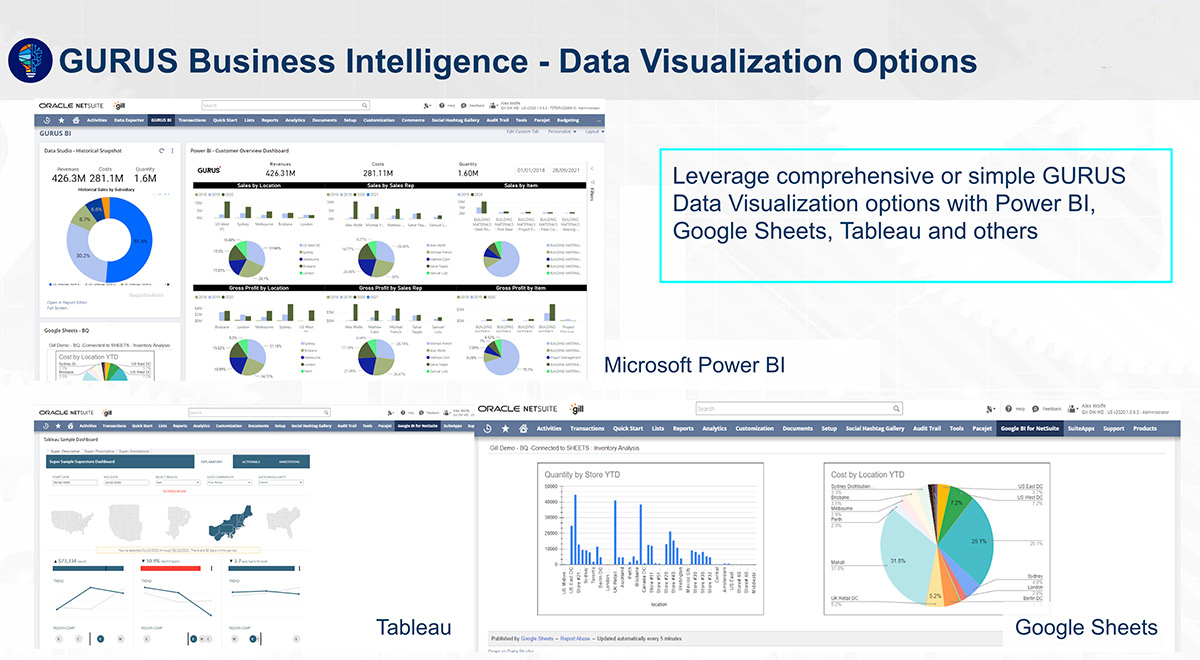
Data Visualization Options
Leverage comprehensive or simple GURUS Data Visualization options with Power BI, Google Sheets, Tableau, and more.
Each business is unique and requires a certain level of adaptability and flexibility. Within GURUS BI, you have Power BI, which is connected to our NetSuite Data Model within BigQuery.
Additionally, there is also Tableau, which provides even more options in terms of connecting the system to necessary data.
Embedded Dashboards
As seen below the GURUS BI dashboard is designed to support embedded URLs of reports generated from most visualization tools.
Reports and dashboards within your NetSuite environment are all based on permission, but today we now have a whole area within the application when you install the bundle. And then you can have a list of all your reports that you built in your personalization tool. In this case, within Google Data Studio.
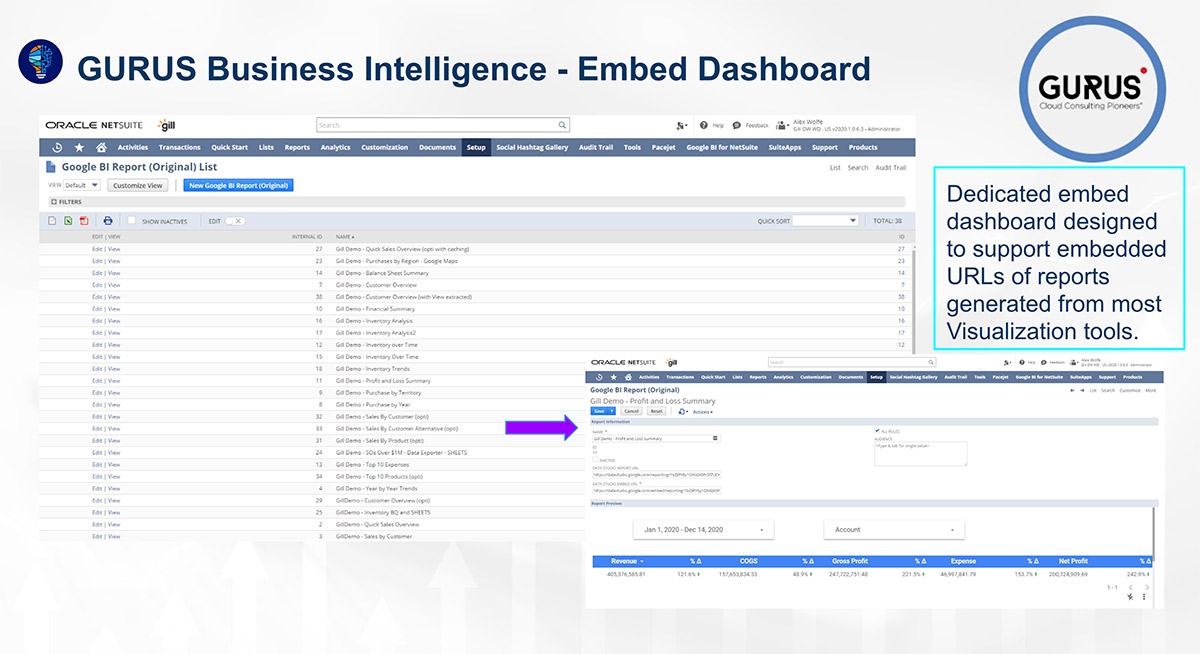
All you need to do is input a URL of points to that report as well as an embed URL, which is standard functionality, and most visualization tools in the marketplace allow you to expose those reports right within NetSuite.
Data Studio Reporting
The reporting tool is designed with drag and drop capabilities that support the concepts of metrics mentioned above to get your own calculated columns.
GURUS Data Studio (GDS) turns your data into informative, easy to read, easy to share, configurable dashboards and reports. With GDS, you can easily report on data from a wide variety of sources.
Collaborate and invite others to view or edit your reports, or send them links in scheduled emails.
BigQuery Public Datasets
Access public data sets from GURUS BigQuery to enhance analysis and reporting via the solution.
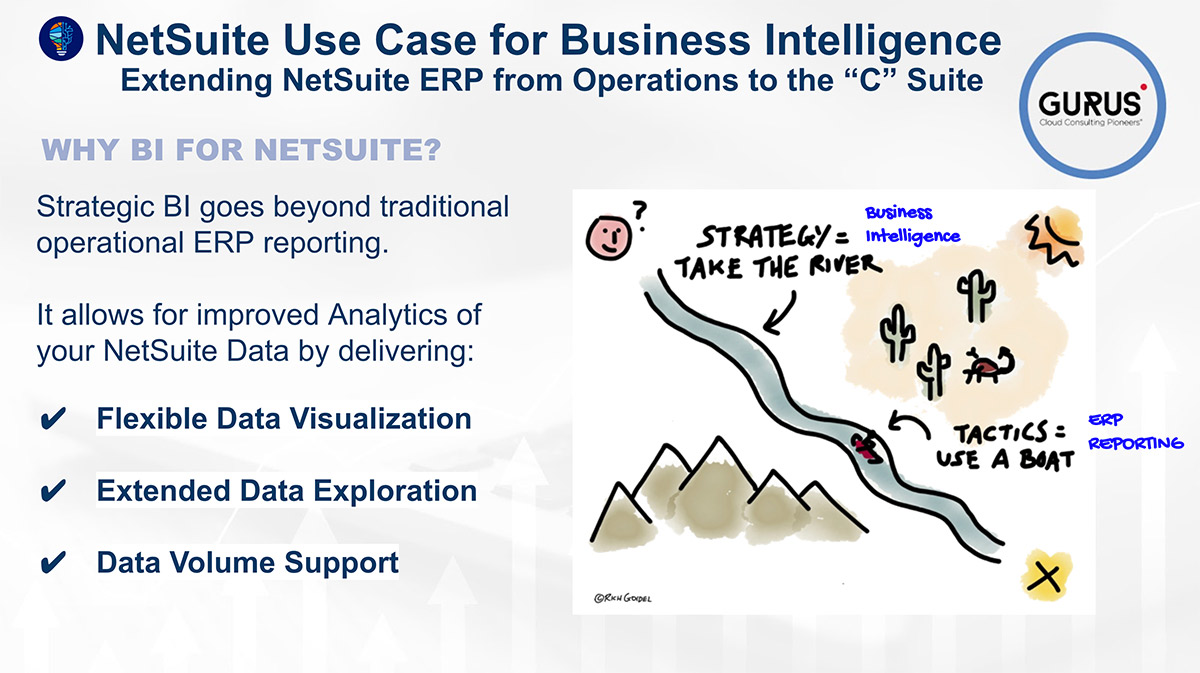
NetSuite Use Case: Plan for BI in your ERP Initiative
When it comes to NetSuite, there are a few things that a business should think about when implementing a new BI tool in order to get the most out of their business intelligence.
Instead of pulling information out of saved searches and putting it into a spreadsheet or another tool and trying to massage it to get better data results, with BI you can address specific areas in a much more user-friendly way.
Flexible data visualization allows users to look at data in different formats such as a pie chart, bar chart, or tabular. That being said, with GEO maps you might consider using a bubble diagram. The options are abundant with BI.
A top and crucial need for business intelligence involves companies with large volumes of data. Perhaps you’re finding that your system cannot handle the massive quantities or it’s very limited. A data warehouse is definitely some place you want to take a look at and evaluate your needs to see if they can be addressed through that system.
One thing is certain, BI is becoming less of a nice to have and more of a necessity for organizations.