Table of Contents
Business Intelligence (BI) for NetSuite, by GURUS, is a powerful turnkey platform built exclusively for NetSuite ERP. Designed to solve common reporting challenges within NetSuite, BI for NetSuite delivers extended enterprise-grade capabilities right inside your NetSuite dashboards. Customers can leverage best-in-class visualization and data warehousing features by Google in order to fully take advantage of their historical data as well as improve visibility and strategic reporting that is critical to growing their business.
Top benefits include:
- Enterprise-grade BI priced for the typical mid-market NetSuite user
- A powerful turnkey Data Warehouse platform that scales with your business
- Accessible reports within your NetSuite system already familiar to your Netsuite user base
- GURUS Solutions technology and expert ERP consultants who have been dedicated to NetSuite for over 15 years
BI for NetSuite is installed by the GURUS BI team. When purchasing the solution, there is a session for configuration and training of GURUS' Business Intelligence.
For additional information, please reach out to your designated sales representative or click here for a demo and pricing.
How much does BI for NetSuite cost?
As each business is unique, our pricing depends on your reporting requirements.
To learn more about our BI pricing, contact us via our online form.
What is Data Visualization?
Data visualization is a complex way to describe presenting information through visual graphics. It highlights patterns and trends in data and helps the reader to achieve quick insights.
The goal of your report is to display crucial data for your audience. Whether your audience is you, your boss, your team, or the wider public, you’ll need to design your report to match their needs. Begin by asking yourself:
- Who is your audience?
- Why are they invested in these analytics?
- What do they already know?
- What do they need to know?
- How is this information intended to drive action?
With these answers, you can provide context and present information measured against the audience’s goals.
Business Intelligence for NetSuite is delivered with Google Data Studio, which allows you to easily build and view reports from scratch or via provided templates.
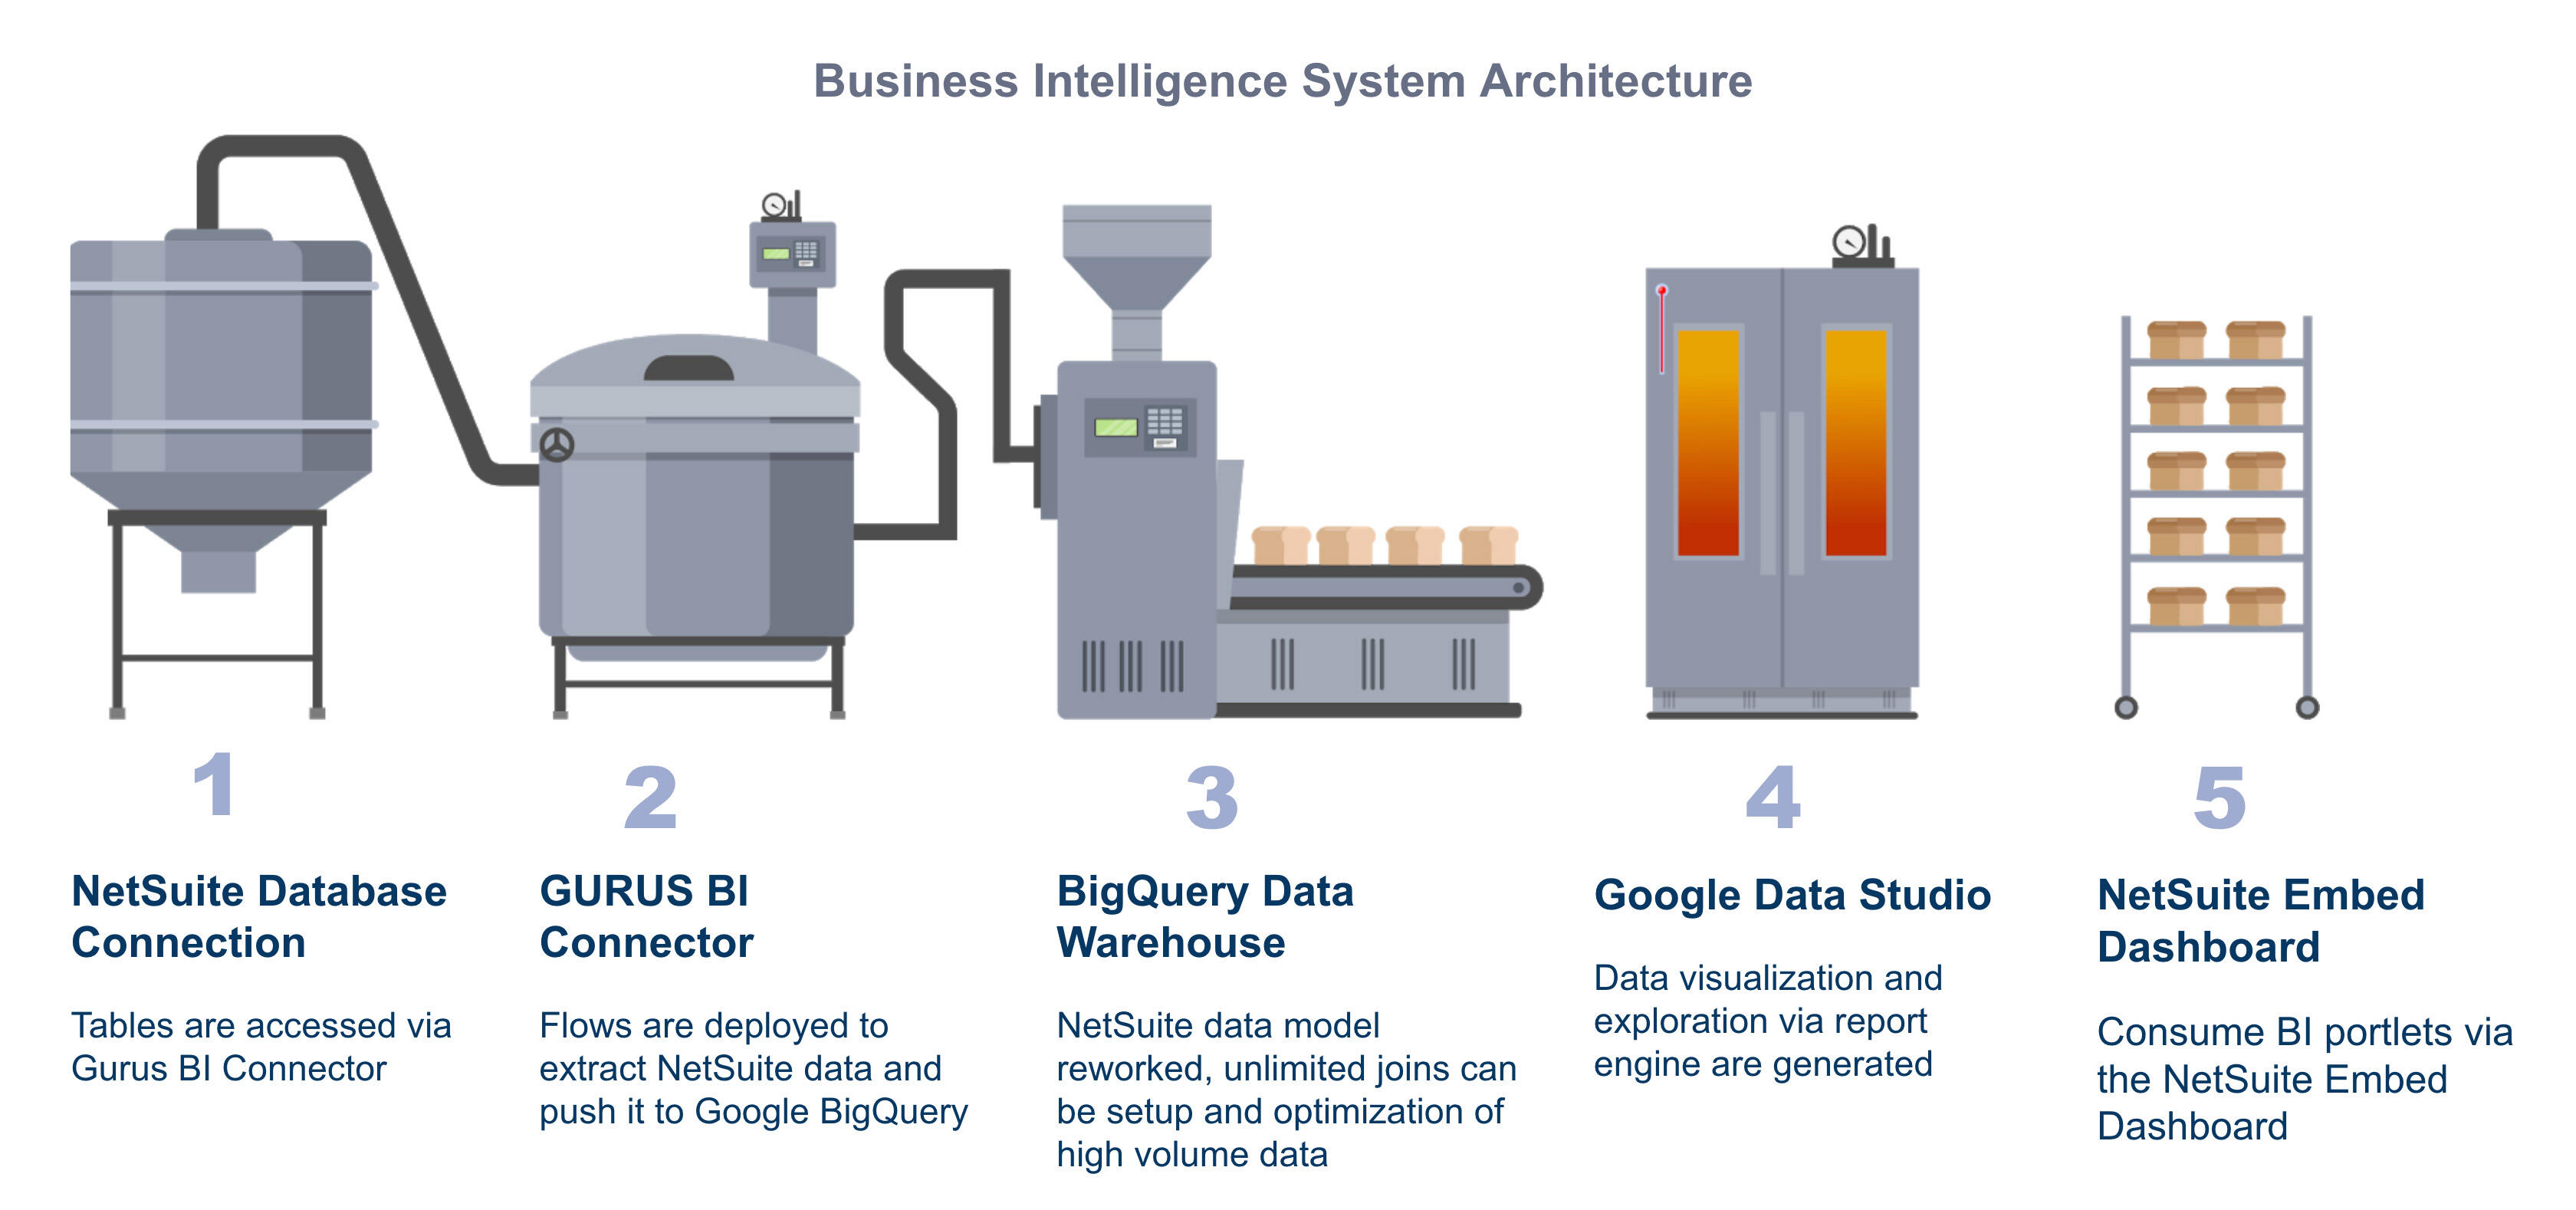
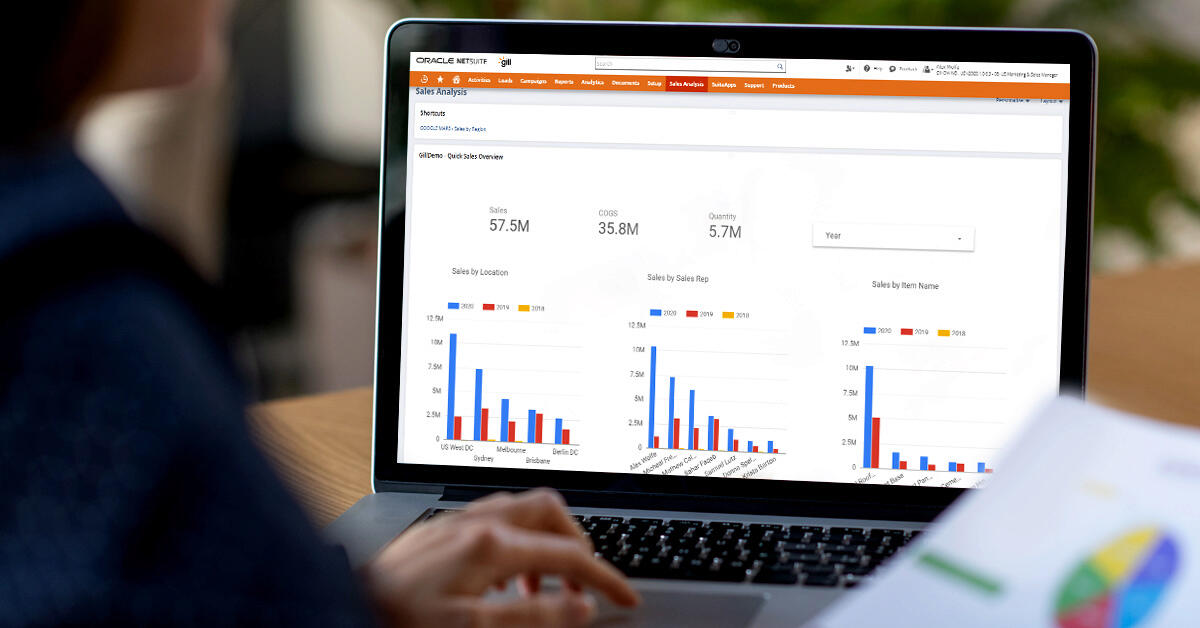
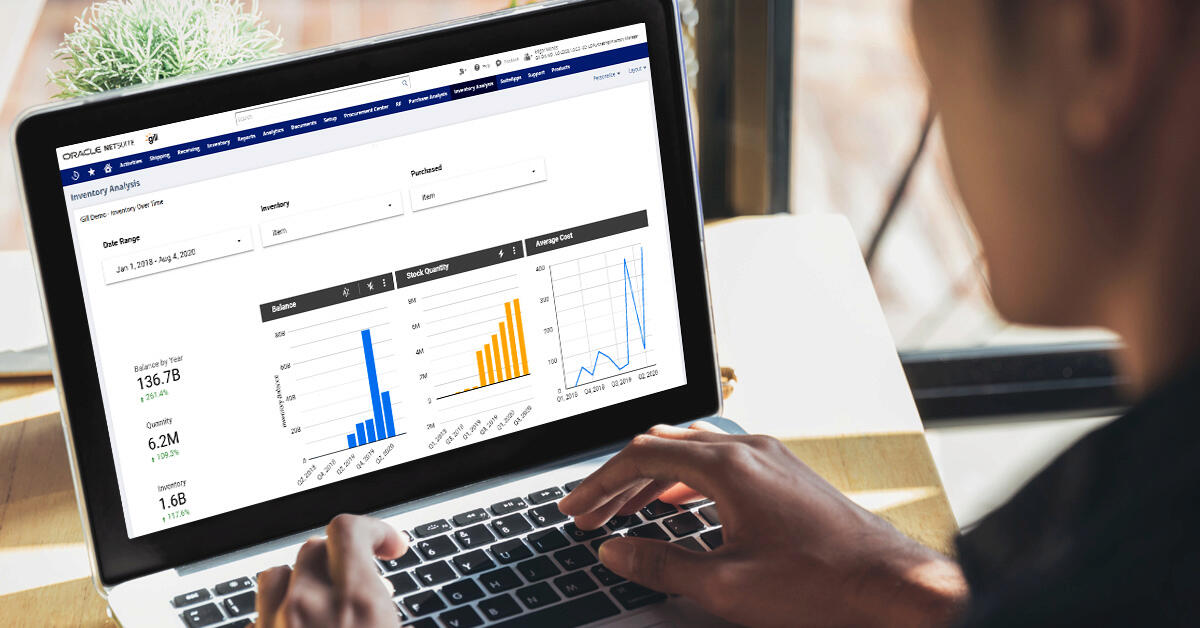
NetSuite data is accessible via the included BigQuery Data Warehouse. Reports are then viewed in Data Studio dashboards and/or the GURUS BI embedded NetSuite dashboard for consumption.
Alternatively, reports can be created in other popular Data Visualization tools (e.g. Looker, Power BI, Tableau, etc.) that can link to the solution as well. Click here to learn more about Google Data Studio.

Bar charts compare metrics using vertical or horizontal bars, and allow you to compare discrete quantities of different categories.
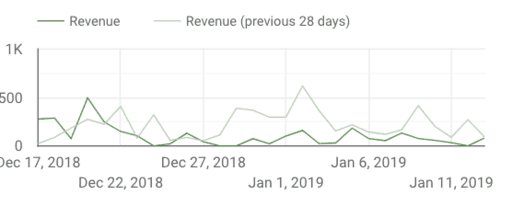
Line charts can easily help depict the relationship between two or more variables over time. Similarly, an area chart can help you discover correlations within a dimension.
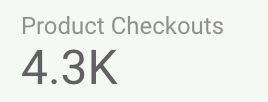
The scorecard shows the total for a single metric. This won’t be grouped with any dimension, but will be impacted by filter controls.

Pie charts compare the parts of a whole, and are most helpful when comparing only two or three values.
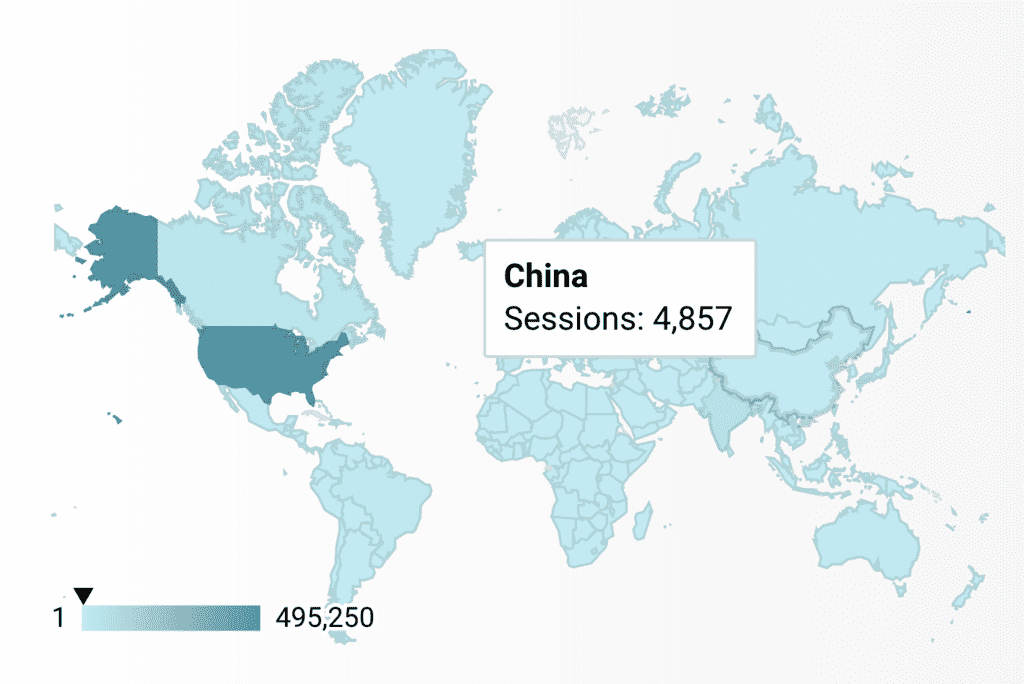
The Geo Map provides an easy way to visualize how a measurement varies across a geographic area. To use a geo map, your data set needs to have geo data, such as latitude, longitude, or AdWords criteria IDs.
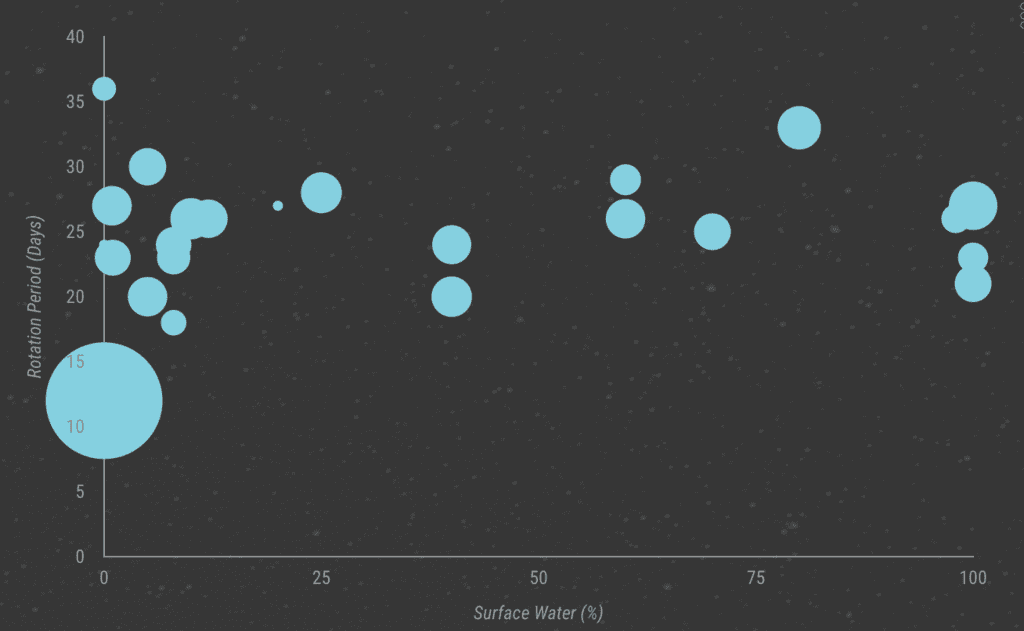
Scatter and Bubble charts help you identify a correlation or lack thereof between data points. These charts show your data as points or circles on a graph using X (left to right) and Y (top to bottom) axes.
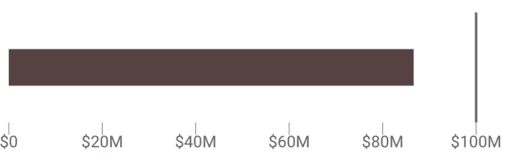
Bullet charts (also known as the: thermometer graph) gives you a way to quickly see how well a given metric is performing against target benchmarks. These only measure horizontally.
What Data Visualization tool is included with BI for NetSuite?
Although our product supports most data visualization tools in the market, Business Intelligence for NetSuite is installed with Google Data Studio and a number of foundational report templates. To learn more or receive training on Google Data Studio, click here.
Both databases and data warehouses are systems that store data, yet, they serve very different purposes.
A database stores real-time information about one particular part of your business. Its main job is to process the daily transactions that your company makes; e.g., recording which items have sold. Databases handle massive volumes of simple queries very quickly.
A data warehouse, on the other hand, is a system that pulls together data from many different sources within an organization for reporting and analysis. The reports created from complex queries within a data warehouse are used to make business decisions.
A data warehouse stores historical data about your business so that you can analyze and pull insights from it. It does not store current information, nor is it updated in real-time.
The GURUS' Business Intelligence system architecture leverages the Google BigQuery Data Warehouse to allow for a more complex reporting that is difficult to achieve directly via the NetSuite database. Its optimized data model allows for better reporting across tables. This quickly accesses higher volumes of data and allows for the consolidation of data within NetSuite and other external data sets (CRM, WMS, POS, etc.).
GURUS Business Intelligence is integrated with Google Big Query where an optimized Netsuite Data Model resides. Click here to learn more about Google BigQuery.
Embed reports into a NetSuite dashboard
GURUS BI reports are initially created in Google Data Studio (or an alternative data visualization supported tool - Looker, Power BI, Tableau, etc.). Once created, embed URLs and report URLs are inputted into the GURUS BI Report Creation Tab for report display via a custom portlet available in the GURUS BI dashboard.
To embed GURUS Business intelligence reports in NetSuite:
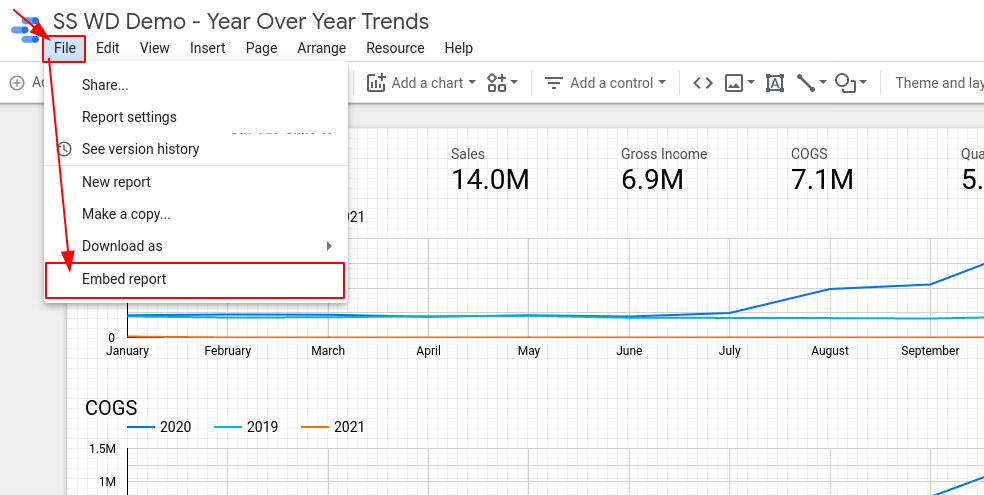
- In Data Studio Copy the “Embed Report” URL
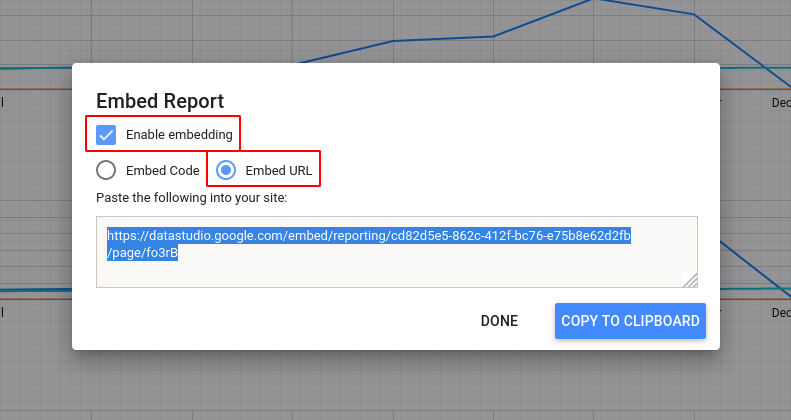
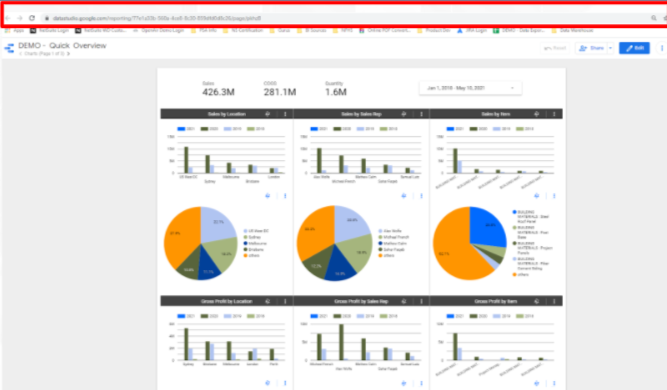
- Within Data Studio, copy the URL page of the Report from the Browser
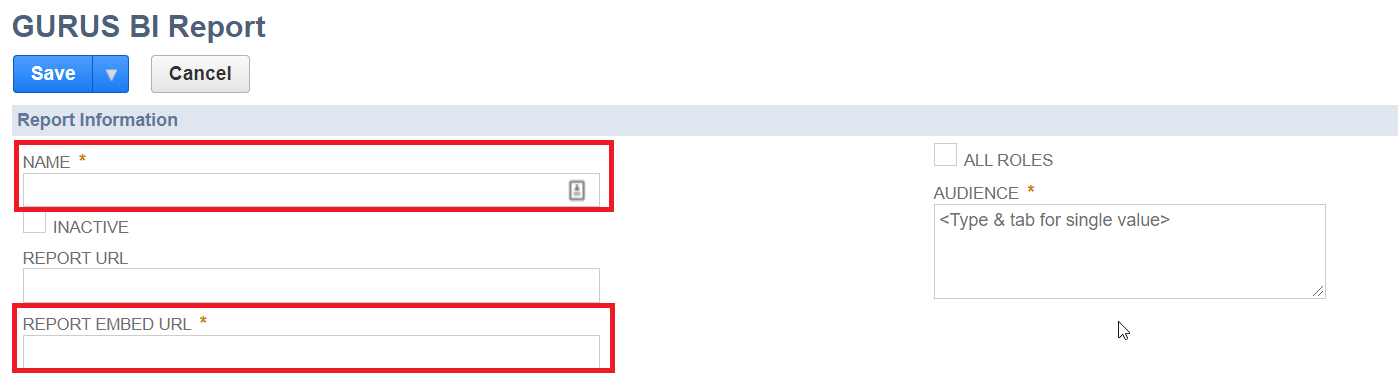
- In NetSuite Select “New” in GURUS BI Reports and create Name. Paste embed URL link and optional direct link to the Data Studio Report
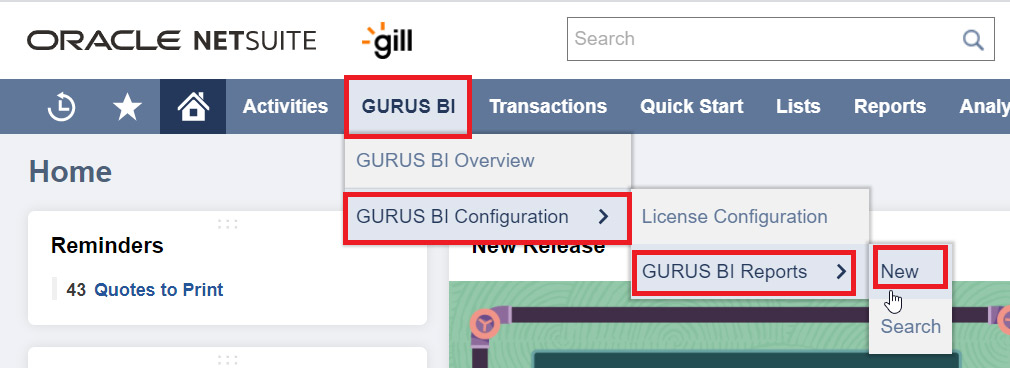
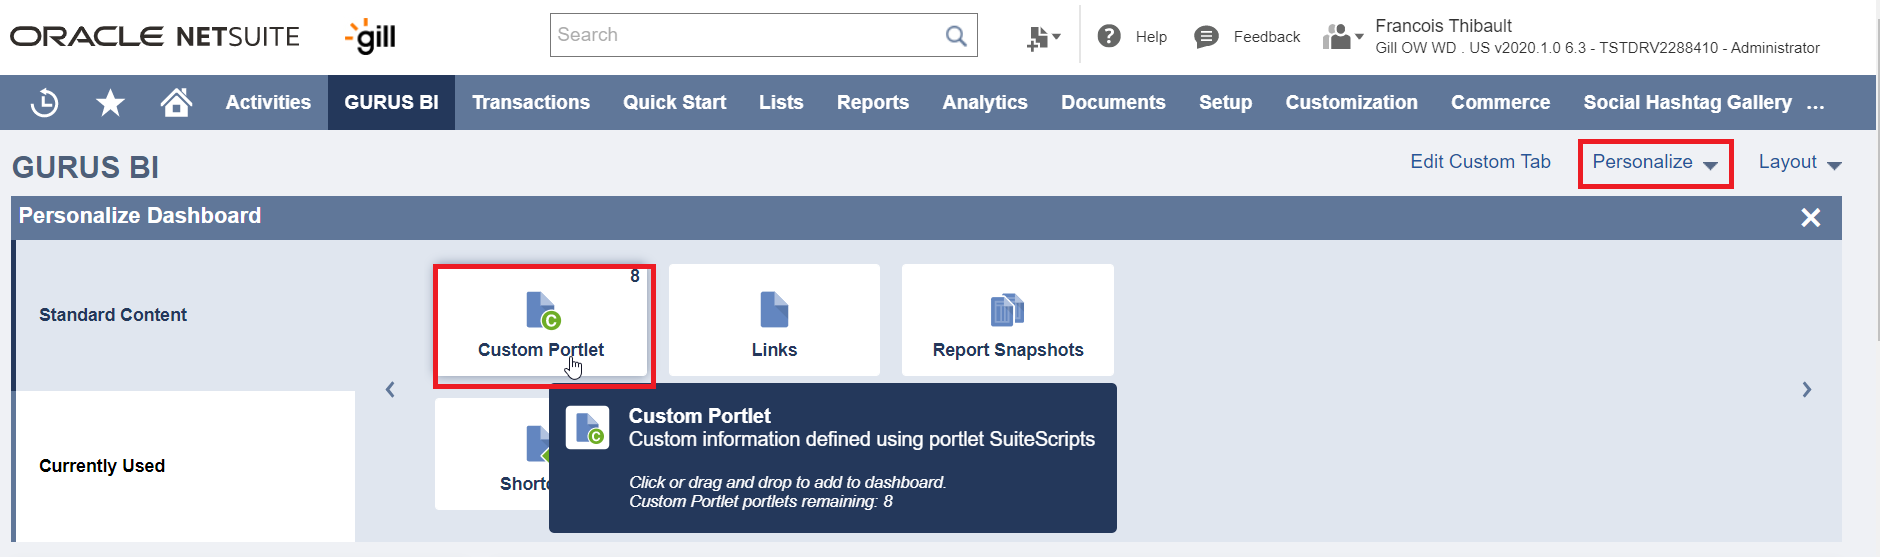
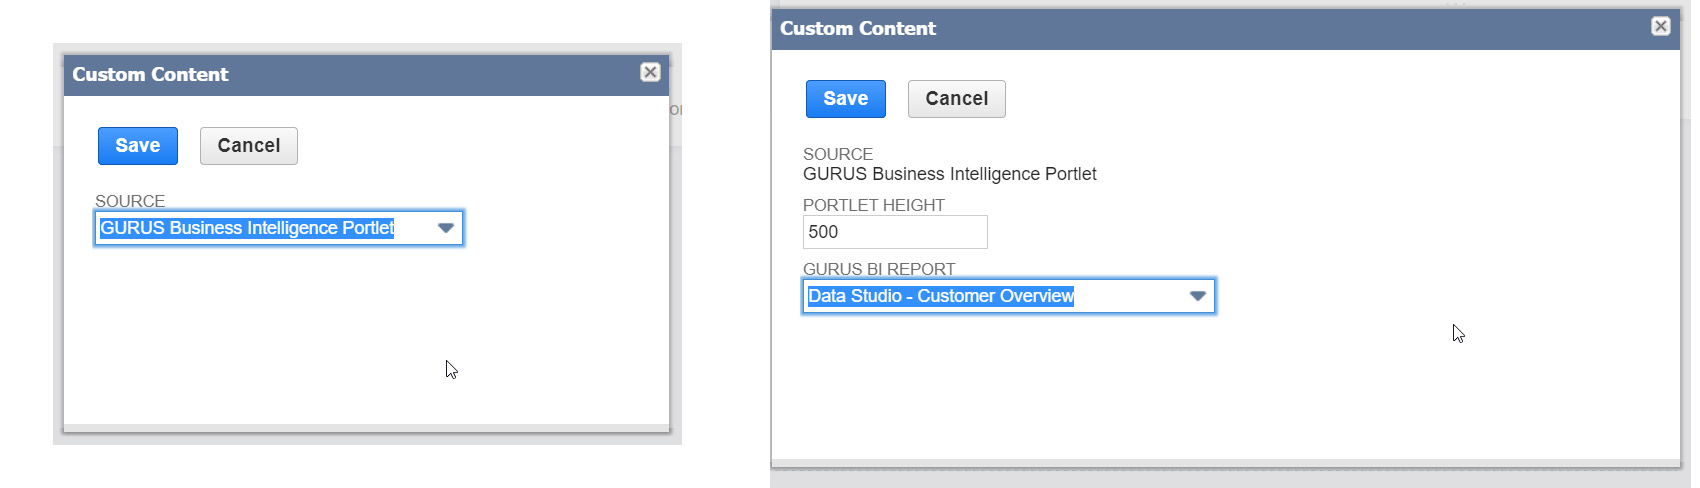
- In NetSuite select “Personalize” and drag and drop “Custom Portal” in the GURUS BI dashboard
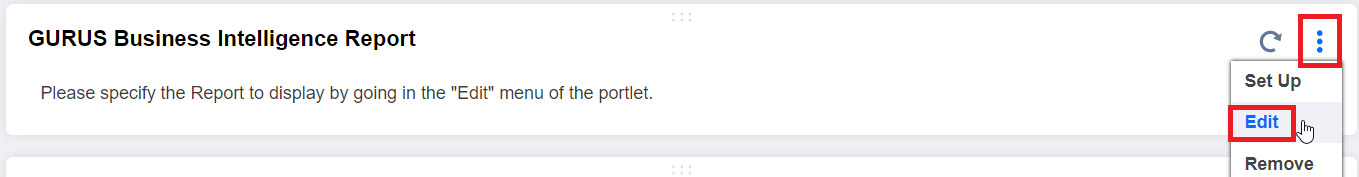
- In NetSuite select “GURUS BI Portlet” from Setup and select created report from Edit
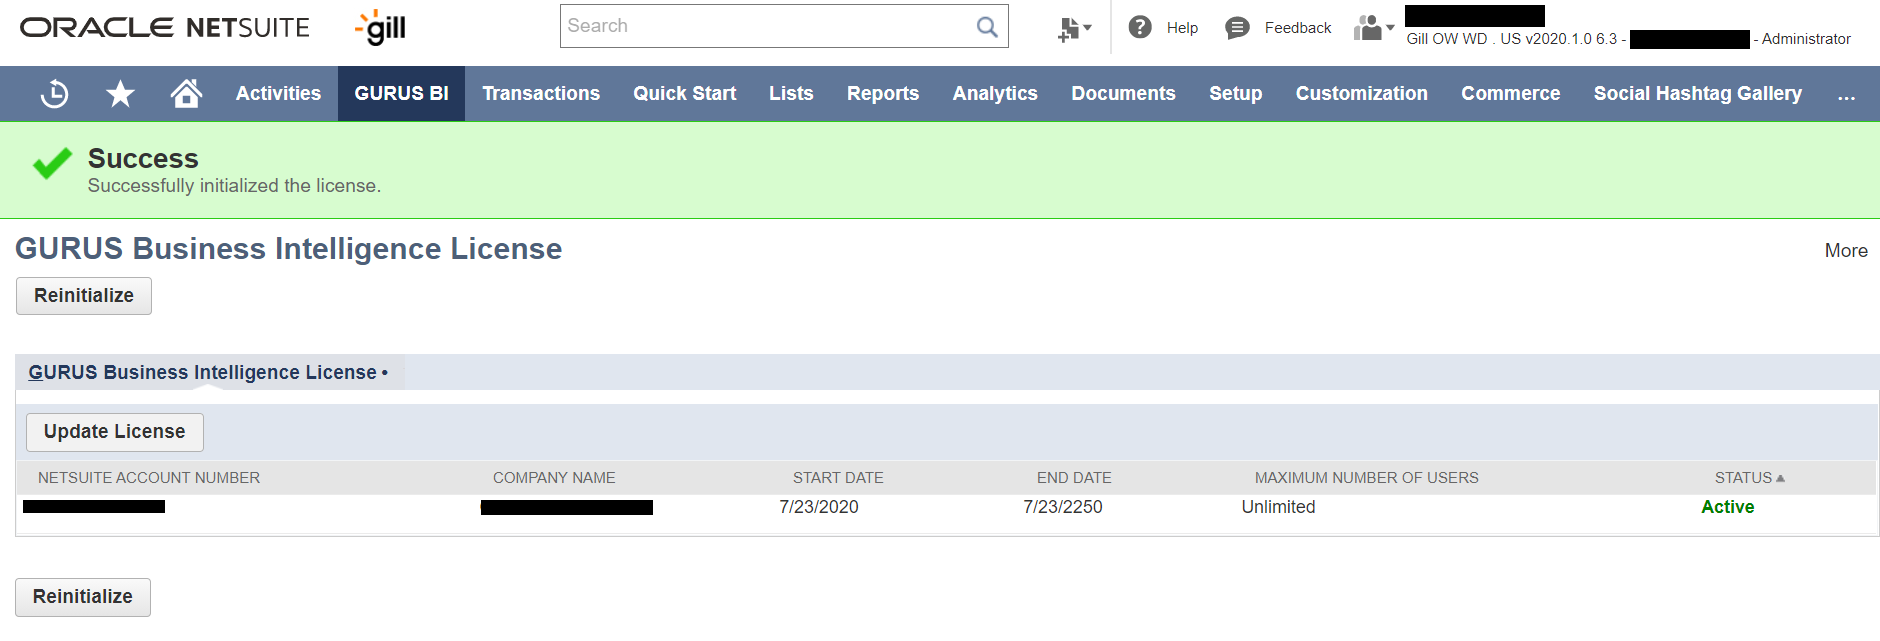
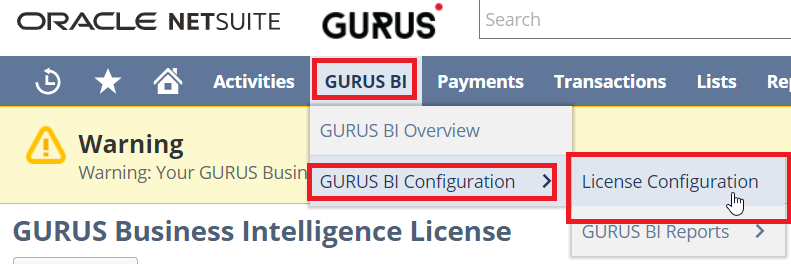
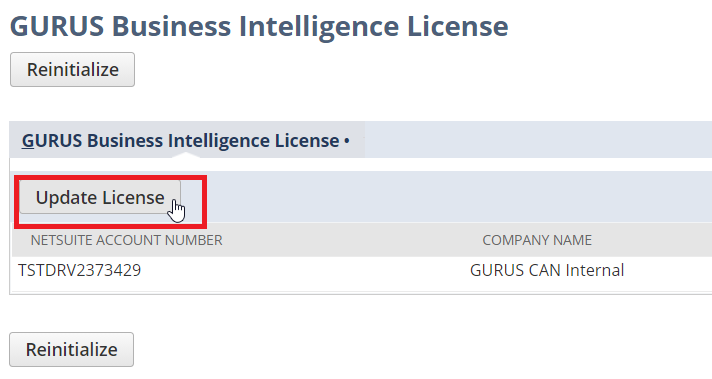
Update Product License
To View Licenses go to “License Configuration” under the GURUS BI Menu.
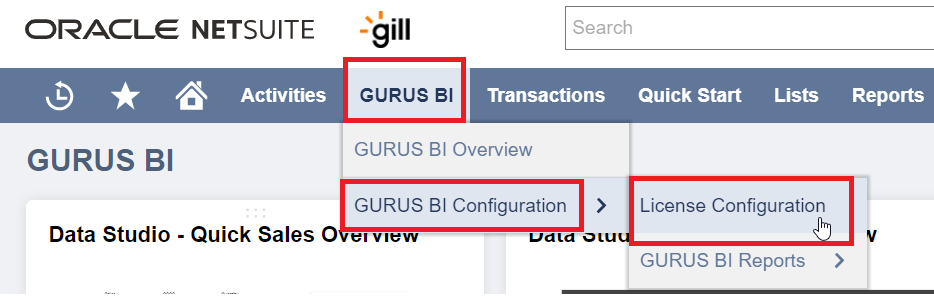
To update click “Update License” in “License Configuration” under the GURUS BI Menu.
Accessing BI for NetSuite
To purchase or review GURUS Business Intelligence please contact the GURUS sales team sales@gurussolutions.com or request a demo or pricing on our website here.
Does the solution allow for customizations?
BI for NetSuite is a highly customizable enterprise-grade BI solution that will address your unique business needs. The GURUS BI team has over 15 years of experience working with NetSuite’s Data Schema with knowledge in scripting and developing custom BI solutions for our customers.
Roles and Permissions
Business Intelligence for NetSuite provides access restrictions at different levels based on your NetSuite instance and the end user of the report.
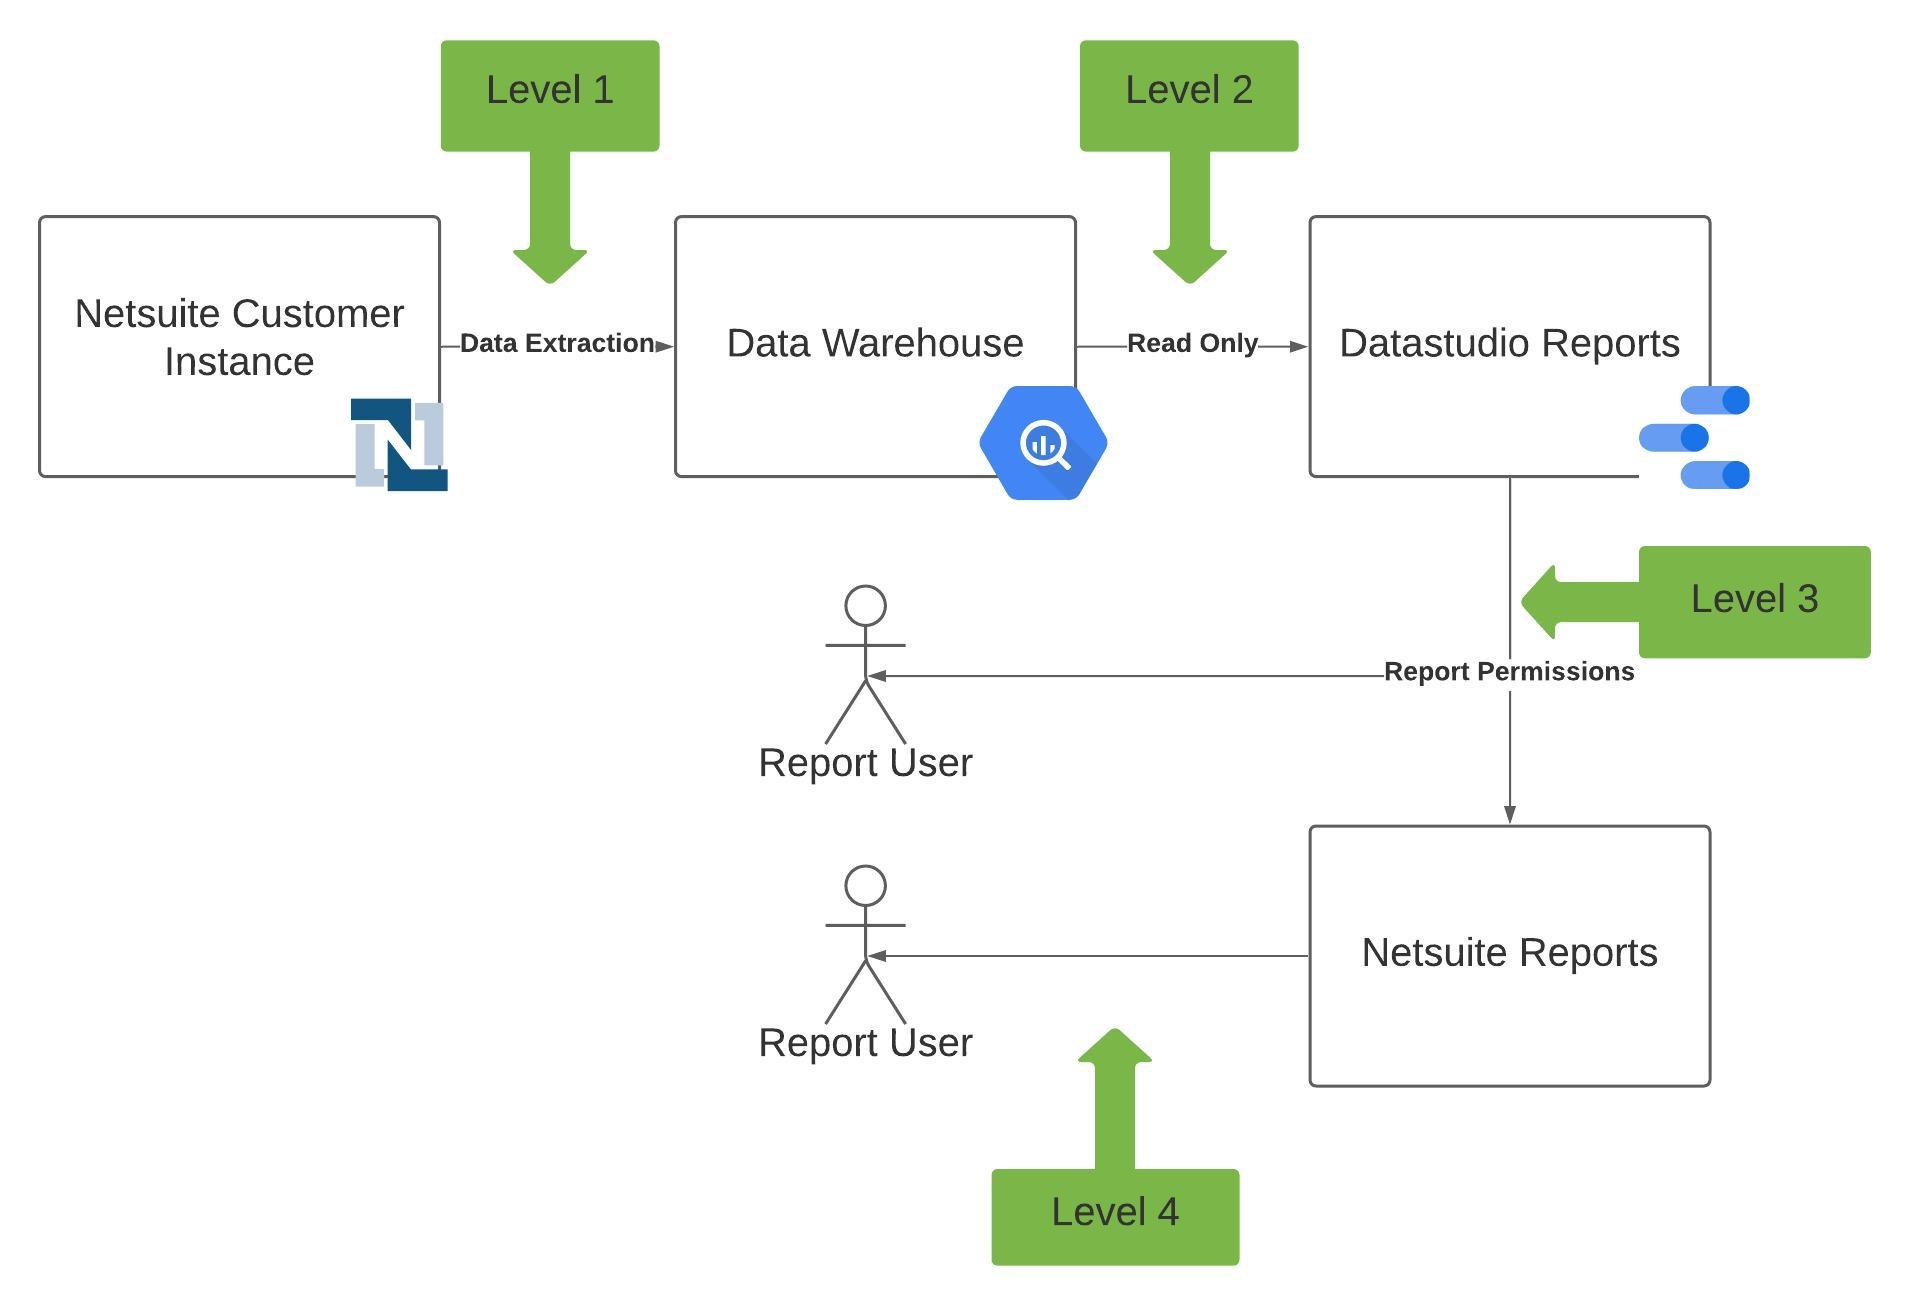
- Level 1: The NetSuite integration
The first level of permission is at the NetSuite integration level. We can configure the integrations with NetSuite to only pull and store the data that you choose to make available for BI for NetSuite.
To do so, we need to adjust the NetSuite role permissions and restrictions that will be used for the Integration portion of Business Intelligence for NetSuite. Please refer to this SuiteAnswers Article to learn more about NetSuite Permissions.
From here we can decide if we bring the data from all subsidiaries, and which record types to bring. All data excluded from this will NOT be available at all from BI for NetSuite. - Level 2: Data Warehouse access
The second level of permission is at the Data Warehouse level. Here, your company can decide which power users - those responsible for building reports for your organization - will get access to the data warehouse. Please note that at this level, the power users will have access, in read-only, to all the data that is transferred from NetSuite.
Only the NetSuite Integration and system administrators from GURUS Solutions have write access to the Data Warehouse. - Level 3: Data Studio Reports (or other visualization tool)
The third level of permission is at the visualization tool level. Google Data Studio is provided with the solution, but any other visualization tool like Looker, Power BI or Tableau also work.
For Google Data Studio, permissions are controlled in a very similar way as with Google Drive. Either directly to each individual user by their email addresses, or through Google Groups, which can contain multiple users. Google Groups can be a very convenient way to add and remove access to groups of reports without having to specify individual emails.
Permissions can be set at the Report level as well as at the Data Set level. Please refer to the following helpful article to learn more about sharing Data Studio reports.
For other visualization tools, please refer to their respective documentation to learn about their permission control mechanism. - Level 4: BI for NetSuite, Reports records and Portlet in NetSuite
The last level of permission is at the GURUS Business Intelligence Report level. When configuring the embedded reports into NetSuite, you can specify to which NetSuite roles those embedded reports are accessible. You can use the Audience multi-select field to select individual roles or check the All Roles box to give access to all roles. Refer to the section on Configuring Reports to know how.
Please note that to access the embedded reports, permissions must also be set appropriately on the Visualization tool as in the previous section.
It is also possible to control who gets access to the Portlet by modifying the Script Deployment Audience. Please contact GURUS Solutions for help with this portion.
Troubleshooting
For additional questions and troubleshooting please refer to the GURUS BI User Guide or contact us at: support@gurussolutions.com.
Frequently Asked Questions & Errors
Q: A User can’t access a Data Studio report.
A: Here are some things to check if your user cannot access a data studio report:
- Is the user logged into their Google Workspace account (or personal Google account your organisation does not use Google Workspace)
- Does the user’s Google account have access to the Data Studio report.The report must have the proper permission set in Data Studio.
- Does the user's role have access to the embedded report in the GURUS BI Report record.
- If none of the above fixes your issue, please contact GURUS Support at support@gurussolutions.com for assistance
Q. I received the message that my license has expired. What should I do?

A: This could mean the following:
- Your license is indeed expired. Please contact your GURUS Representative to renew it
- If you have renewed, your license might not have updated properly. Navigate to GURUS BI -> GURUS BI Configuration -> License Configuration and click Update License to refresh the license.
Q: We went through some company changes, and some of our segments (Class, Location, Department, Subsidiary) have changed, how do I update them?
A: Contact us at support@gurussolutions.com and we will update it for you.
Q: I want to add new fields or new records to my GURUS Business Intelligence setup, how do I add them?
A: Please contact your GURUS Sales representative to discuss the addition of custom components to your setup.
Q: Can I do my financial reporting using GURUS Business Intelligence?
A: The tool technically contains all the data necessary to do the financial reporting, the application does not contain out of the box the mechanism to perform the Elimination and the Consolidation that NetSuite provides. These mechanisms would need to be developed as custom reports.
Acronyms and Glossary
|
|
|
| GCP | Google Cloud Platform |
| BI | Business Intelligence |
| BQ | Google BigQuery |
| AI | Artificial Intelligence |
| DW | Data Warehouse |
| Terms | Definition |
| Data Studio | Google Data visualization tool |
| BigQuery | Google Data Warehouse tool |
| View | A view can be thought of as a table in a database. The only difference is that a view doesn’t store data, it instead will get it’s data from one or more other tables. Using a view, one can effectively create custom tables without needing more storage. |
| Data Model | Collection of BigQuery tables, views, with a specific set of fields, created to represent your NetSuite Data within BigQuery. The GURUS BI Data model is only a subset of the NetSuite data model. |
| Portlet | A Portlet is a section of a NetSuite Dashboard that serves a specific purpose. A Dashboard consists of multiple portlets. The GURUS BI Portlets are used to embed your GURUS BI reports directly into a dashboard. |
| Dashboard | A NetSuite Dashboard is the page attached to a NetSuite center tab. (ex: the Home or the GURUS BI tab). It contains one or multiple portlets that each have their own functions. |
| Report Template | Template of a Google Data Studio Report, created based on the Generic Data Model, that can be used as an example to create your own reports. |
| End-to-End Testing | End-to-end testing is a methodology used to test whether the flow of an application is performing as designed from start to finish. The purpose of carrying out end-to-end tests is to identify system dependencies and to ensure that the right information is passed between various system components and systems. |