As more and more companies realize the need to digitally transform their core processes, more often than not they turn to business intelligence. For those who already have an ERP (Enterprise Resource Planning) system in place, their objective becomes to find a specialized BI tool that not only complements their ERP, but will also fill in that technological gap within each department.
At GURUS Solutions, it was a no-brainer when we decided to design the ultimate BI solution for NetSuite ERP. Our 15+ years of experience have constantly shown us the pain points and challenges companies face when it comes to having a proper business intelligence tool. Since each department has different KPIs and objectives, it became obvious that we needed to create a product that solved each individual problem.
Want to try them out? Download our free Power BI templates for NetSuite and explore interactive dashboards built for sales, finance, and more.
Request More Info From an Expert
Leveraging Power BI and Looker Studio, we provide customers with full access to a comprehensive set of powerful templates addressing the reporting needs of stakeholders in your business.
What are reporting and dashboard templates?
How reporting is used varies on the needs and requirements of each department. The GURUS BI tool has created two types of reports and dashboard templates to meet these needs.
Templates are available either “as is” or they can be customized to fit your specific business demands. These templates are tailored to data analysis across areas, such as:
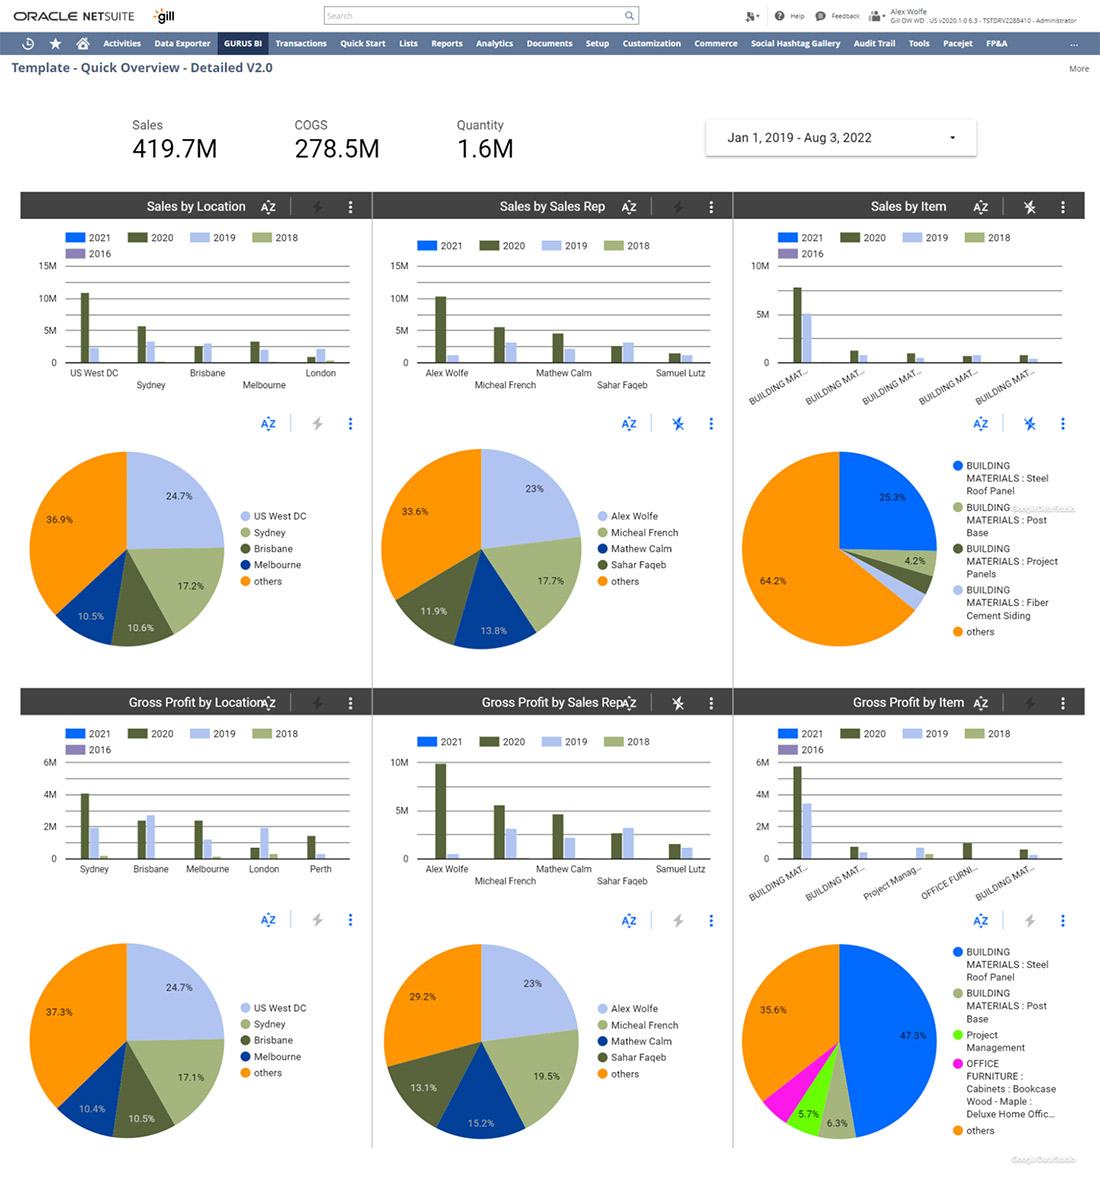
Executive Analysis Reporting Template for NetSuite
When you’re at the top of the company food chain, one thing is certain, your need to make strategic decisions on the spot, which can often lead to breakout sweats if the crucial data isn’t clear, ready, and available.
We’ve got a towel and report templates just for you. Designed to deliver powerful insights to all executives and managers, it highlights key NetSuite financial, operational, and strategic metrics aligned with your industry needs.
NetSuite Executive Reporting Template – Looker Studio
NetSuite Executive Reporting Template – Power BI

Executive Reports include
- Sales by Product, Location and Item
- Gross Profit by Product, Location and Item
- Revenue by Transaction Type, Quantity and Sales Rep
- Year-Over-Year Trends of Sales, COGS, Gross Profit and Quantity
- Year-Over-Year Trends by Subsidiary, Location, Item, Amount Account Type and Transactions
Sales Analysis Reporting Template for NetSuite
The sales cycle is long. Access to data - and in real-time - is vital for Business Development Executives to keep track of their pipeline and prospects. Without the proper information, deals can be lost or stagger in a certain stage without moving forward.
That can all be solved with the flexibility of sales templates for leaders and team members who manage sales pipelines, forecasts and quotas. Sales analysis report templates deliver drillable sales reports and dashboards for better visibility across the business.
NetSuite Sales Analysis Reporting Template – Looker Studio
NetSuite Sales Analysis Reporting Template – Power BI

Sales Reports include
- Revenue by Time, Customer, Location, Transaction and Account Type
- Sales by Gross Profit, COGS and Quantity
- Sales by Transaction Item, Location and Sales Rep
- Opportunity by Sales Rep, Status, Subsidiary, Customer and Project
- Opportunity Snapshot Pipeline by Projected and Forecasted Amounts
Free Resource
Explore our most-used Power BI dashboards, built for NetSuite
Download the sample report here
Purchasing Analysis Reporting for NetSuite
Having that competitive advantage when it comes to purchasing is a game changer. You’re able to focus on transforming regional data to ensure profitability instead of making ill-informed business decisions that lead to financial loss.
From vendor analysis to tracking purchasing trends, the purchasing analysis report templates deliver both graphical and tabular insights filtered by your NetSuite segments.
NetSuite Purchasing Analysis Reporting Template – Looker Studio

NetSuite Purchasing Analysis Reporting Template – Power BI

Purchasing Reports include
- Purchasing by Location, Transaction and Vendor
- Purchasing by Country, State and City
- Purchasing by Account Type, Date, Quantity and Amount
Project Analysis Report Template for NetSuite
Let’s be real, when it comes to professional services, managing teams and clients can be stressful. And more often than not, project managers do not lead one specific project, but rather a few that expand across multiple business activities.
The project analysis report templates provide project financial reporting and key project metrics to empower project leaders and teams. This is an ideal template for a professional services organization or a SaaS company.
NetSuite Project Analysis Reporting Template – Looker Studio

NetSuite Project Analysis Reporting Template – Power BI

Project Management Reports include
- Project Billing, Costs, and Margins
- Service Item Performance by Average Billable Rate and Billable Hours
- Purchasing by Account Type, Date, Quantity and Amount
- Average Billable Hourly Rate and Average Profit Margin by Projects and Service Items
- Project Status, Billabl;e hours and Profitability
- Project Billing Over Time, Planned Billing and Planned Costs
Inventory Analysis Report for NetSuite
It’s rare that a company doesn’t complain when they’re over- or under-stocked with inventory. Trying to get that sweet spot of the perfect inventory amount is not for the faint of heart. However, we never said it was impossible.
The inventory analysis report templates allow your team to increase inventory visibility and movement across all your NetSuite segments and transactions. When it comes to product-based businesses, understanding stock and product is key.
NetSuite Inventory Analysis Reporting Template – Looker Studio

NetSuite Inventory Analysis Reporting Template – Power BI

Inventory Management Reports include
- Inventory by Product Category and Location
- Inventory Movement by Changes and Product Categories On-Hand
- Inventory by Quantity, Item, location, Account Type and Transaction Type
Financial Analysis for NetSuite
Ah, money, it really does make the world go round. To avoid being in the red and staying in the black, a modern BI solution is essential. It will help you analyze data and keep income and expenses under control.
The financial analysis report templates allow users to enhance their NetSuite financial reporting needs with segment level insights on financial statements driving your business.
NetSuite Financial Analysis Reporting Template – Looker Studio

NetSuite Financial Analysis Reporting Template – Power BI

Finance Reports include
- Profit and Loss, Summary of Income, Expenses, COGS, Gross Profit, and Net Profit
- Income, Expenses and COGS Amounts by Account Type
- Revenue and Expenses Amounts by Entity, Subsidiary, Accounts, Transactions and Period
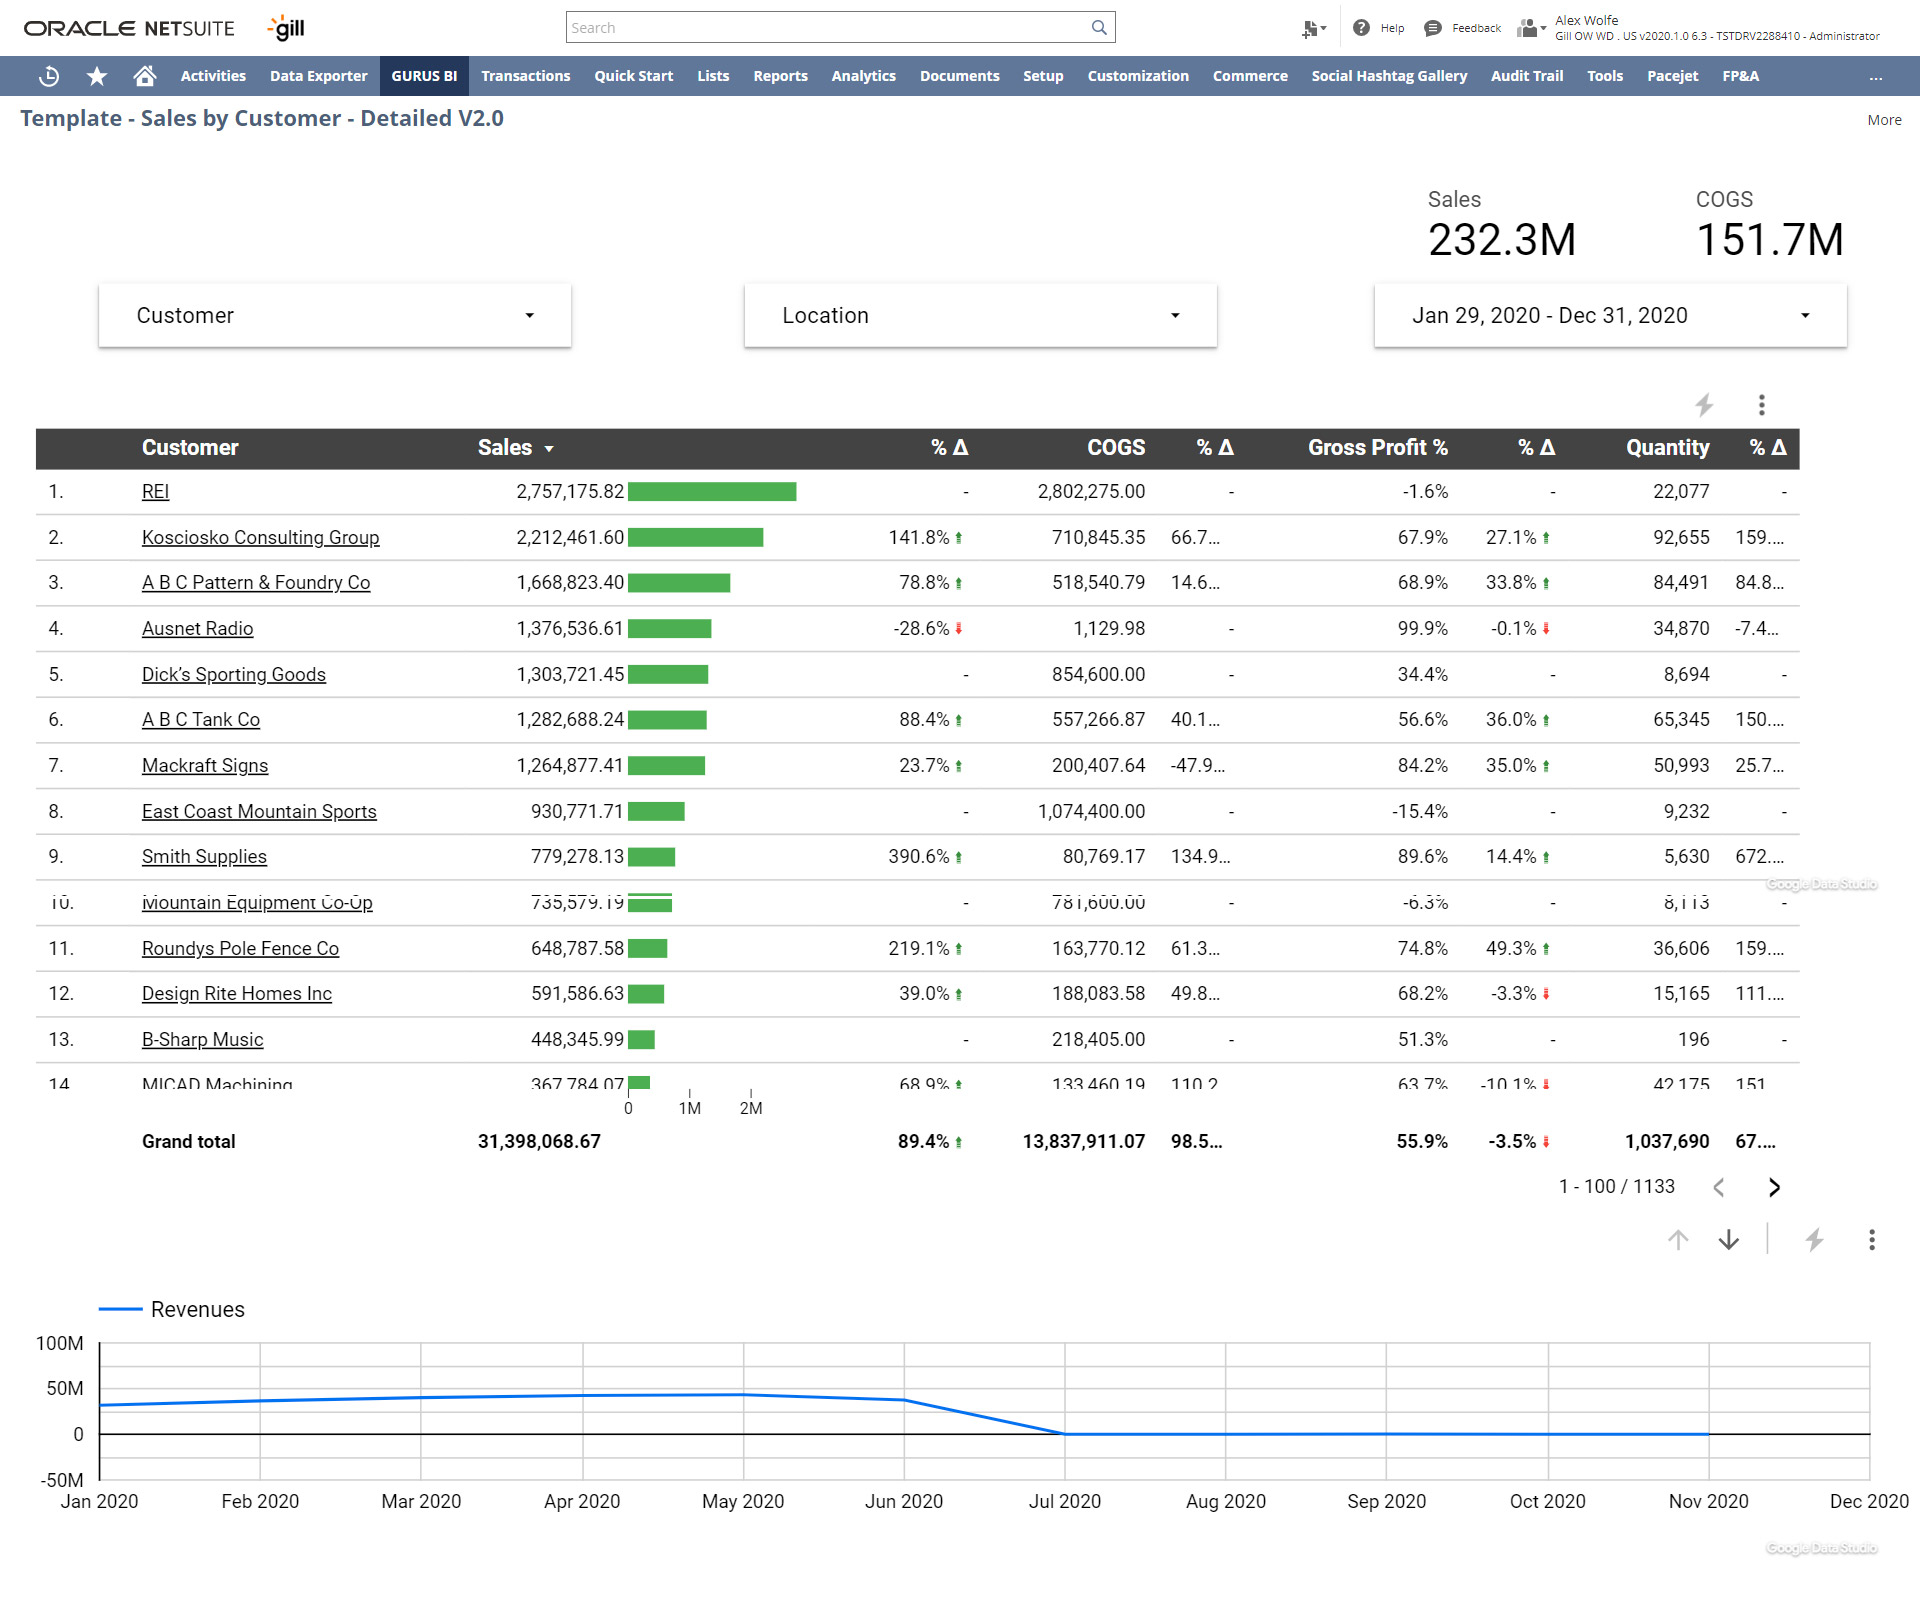
Customer Analysis Report for NetSuite
Customer data is not to be messed with. For companies that specialize in service, you can do no wrong if you transform that data into stellar customer service.
The customer analysis report template delivers flexible NetSuite reporting metrics highlighting customer financials and trends impacting your business. In turn you will have better insights to target customers, allowing businesses to improve service delivery and identify new business opportunities.
NetSuite Customer Analysis Reporting Template – Looker Studio

NetSuite Customer Analysis Reporting Template – Power BI

Customer Experience Reports include
- Customers by Revenue, Location and Period
- Customer Income and Expenses by Country, State and City
- Customer Incomes and Expenses by Item Category, Quantity, Transaction and Amount
How organizations use business intelligence (BI) systems differ depending on industry verticals, unique challenges, and certain pain points.
The customized (or not) templates with BI for NetSuite show how business intelligence can work for different departmental organizations to ensure success.
Talk to our product team to find out more about Business Intelligence for NetSuite templates and how they can fix your reporting challenges. Or skip ahead and download a free sample of our Power BI NetSuite reports to explore for yourself.
FAQs
1. Can I create a custom financial statement in Power BI and Looker Studio via BI4NetSuite?
Yes, you can create a custom financial statement in both tools. Power BI is the most flexible option, allowing you to design detailed income statements, balance sheets, and cash flow reports once the NetSuite data is connected through BI4NetSuite. Looker Studio can also be used for custom financial statements, although its capabilities are more limited and may require additional data preparation. BI4NetSuite itself provides built-in financial templates and enables users to customize statements directly or via integrations with tools like Power BI.
2. Can you embed Power BI and Looker Studio reports and dashboards via BI4NetSuite?
Yes, you can embed dashboards directly into NetSuite via BI4NetSuite standard functionality. Embeds for both Power BI and Looker Studio dashboards into NetSuite ares upported by the BI4NetSuite platform.
3. How can you create permissions to access a subset of NetSuite data in Power BI and Looker Studio?
Permissions can be managed through both the BI4NetSuite layer and the BI tools. BI4NetSuite allows you to configure which data users can access before it reaches the visualization tool. In Power BI, you can enforce row-level security (RLS) using DAX filters and user roles, often tied to Azure Active Directory. In Looker Studio, native row-level security is more limited, but you can work around this by applying filtered views or using intermediate layers like BigQuery or Google Sheets to control data visibility by user.
4. Are there AI features with Looker Studio and Power BI? And what are they?
Yes, both tools offer AI capabilities, though Power BI is more advanced. Power BI includes features like Smart Narrative, which generates natural language summaries of data, and a Q&A tool that allows users to ask questions in plain English. It also integrates with Azure Machine Learning for more advanced analytics, and Microsoft's Copilot can assist in generating reports and analyzing trends. Looker Studio has built-in AI features via Gemini AI and can also integrate with external AI tools such as BigQuery ML, Vertex AI, or other machine learning platforms to incorporate predictive insights or classification models into dashboards.
5. Can you link NetSuite transactions and records to Power BI and Looker Studio reports?
Yes, NetSuite transaction data and records can be linked to reports in both Power BI and Looker Studio, especially when using BI4NetSuite. BI4NetSuite organizes NetSuite’s raw records like invoices, journal entries, and purchase orders into structured, relational models that are easily consumable in external BI tools. Once in Power BI or Looker Studio, you can create relationships and references between transactions and master data like customers, vendors, or GL accounts.
6. How do you blend an external data source with the NetSuite data accessible in BI4NetSuite?
Blending external data with NetSuite data is possible in both Power BI and Looker Studio once the data is extracted through BI4NetSuite. In Power BI, you can import data from other sources such as Excel, APIs, SQL databases, or cloud services and merge or join it with the NetSuite data using Power Query and the data modeling interface. In Looker Studio, you can use the data blending feature to combine NetSuite data with other sources like Google Sheets, BigQuery, or external APIs, though blending is limited to left joins and may be less flexible compared to Power BI.
Request More Info From an Expert