
Table of Contents:
- Business Intelligence (BI) for ERP Product Comparison Guide
- Is the data visualization solution in line with NetSuite’s current business model?
- Can the data visualization tool be easily integrated into NetSuite and comply with the current roles and permissions?
- Can this data visualization platform integrate both internal and external data sources?
- Are multiple visualization options and data warehouses supported?
- Can users easily consolidate data sources, build reports and drill into transactional data right within NetSuite?
Business Intelligence (BI) for ERP Product Comparison Guide
Buyers of ERP typically enter the market to solve 3 core challenges:
- Streamlining business processes
- Centralizing mission-critical business data
- and implementing a system to scale with their current and future growth
The capturing, sharing and tracking of operational information tends to be the primary focus in their selection process for a new ERP system. Unfortunately, reporting and analytics are (in too many cases) initially treated peripherally. Analytics tends to emerge when the “ERP Change” dust settles a number of years into production, when stakeholders begin to mine their systems to maximize the business information at hand. In general, core operational decisions are handled quite well with a robust ERP solution.
Request More Info About Boomi NetSuite Integration Guide for ERP & Apps
However, when organizations are seeking to address the more complex and strategic analytics impacting executive decision-making, the operationally-focused ERP solution can fall flat.
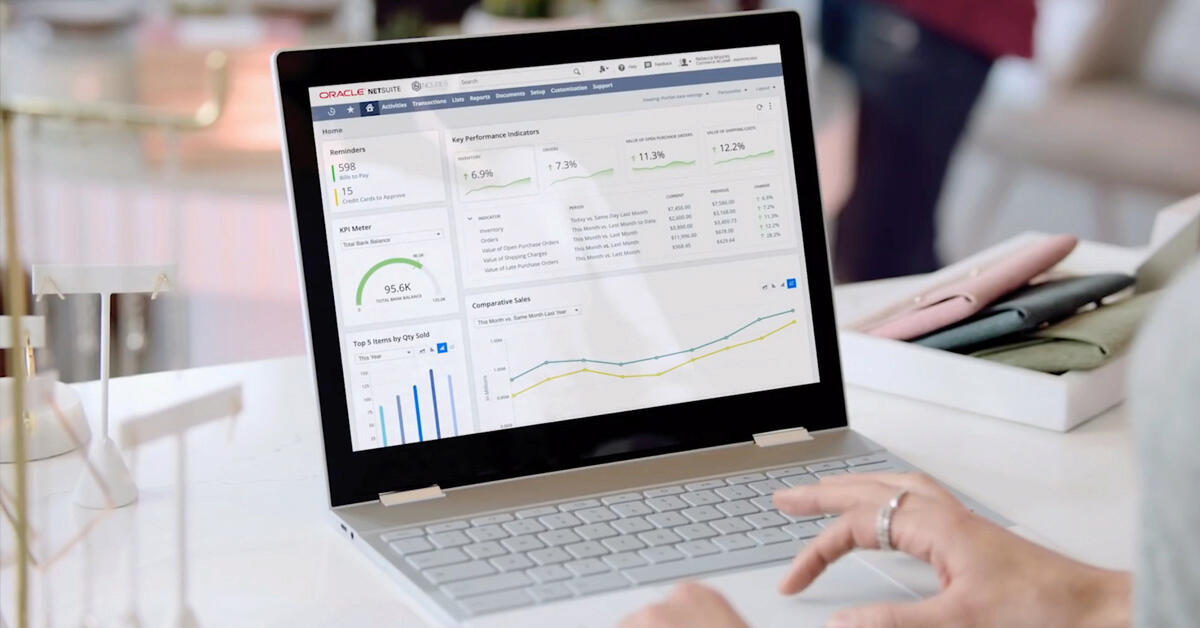
NetSuite customers often face the challenge of exploring their data quickly and delivering effective visuals to Management. Although NetSuite provides amazing flexibility in generating saved searches and drilling into transactional information, in some cases, the consolidation of business data can be difficult.
Multiple Saved Searches, which are limited to single joins and native charting that is offered sporadically, can result in the extraction of ERP data into external spreadsheets and tools. The purpose is to get to the visuals and reporting necessary for executive decision making.
Fortunately, the Business Intelligence and Data Visualization marketplace is quite mature and in the last 10 years or so have focused on serving the Mid-Market customer.
For the NetSuite customer, Data Visualization solutions offer an excellent entry in solving the Analytics challenges they face frequently.
For NetSuite customers, there are a number of considerations that need to be taken into account in order to solve their reporting obstacles and to achieve strategic analytics within their Netsuite Platform. When you’re looking at the options on the market for the right solution, these are the important questions you should be asking:
1. Is the data visualization solution in line with NetSuite’s current business model?
It’s likely that whichever complementary data visualization solution you are evaluating, your selected solution will need to be in line with the similar SaaS delivery and 100% cloud capabilities you are benefiting from with NetSuite. Although most solutions are cloud-based, only a few are built from the ground up with a SaaS model in mind.
Similar to NetSuite, Google’s data visualization offerings with Looker Studio have been designed to only be delivered via a SaaS model. This ensures NetSuite customers get a user experience that is in line with their current technology stack.
2. Can the data visualization tool be easily integrated into NetSuite and comply with the current roles and permissions?
Although NetSuite has NetSuite Analytics Warehouse (NSAW), best-of-breed data visualization options outside of the NetSuite ecosystem tend to be a better choice for most customers.
Most of the mid-market players, such as Looker Studio, Power BI, Tableau, Domo, Qlik and others have partner and native connectors to deliver robust functionality right within the NetSuite Platform.
That being said, it is key to have a partner who understands the NetSuite data model to ensure your organization can get the best reporting in line with your needs.
3. Can this data visualization platform integrate both internal and external data sources?
Data Visualization will not only facilitate the mining and consolidation of NetSuite data, but should also provide the ability to connect to other enterprise data sources (CRM, PLM, SCM, WMS, etc.) for next-level reporting.
It’s also important to evaluate the flexibility in accessing these data sets. For example, Is this achieved via limited NetSuite saved searches? Or is there a connection directly to the NetSuite database tables?
Once again, understanding the NetSuite data structure and the integration options of the solutions in the marketplace will impact the types of reports you can expect to generate with these reporting tools.
4. Are multiple visualization options and data warehouses supported?
It is important to remember Data Visualization solutions are truly the front end to the data sources they connect to. Hence, robust solutions will have multiple options to connect to popular Data Warehouses which will optimize the performance and ability to get the best reporting possible from NetSuite and complementary systems.
All of the popular data visualization solutions are designed to connect to the major Data Warehouses such as Google BigQuery, Amazon Redshift, Microsoft Azure, Snowflake, etc.
Keep in mind, whichever solution you choose needs to scale with your business and deliver an ROI in line
5. Can users easily consolidate data sources, build reports and drill into transactional data right within NetSuite?
Although NetSuite does provide some native data visualization out-of-the-box, best-of-breed solutions will offer way more flexibility in working with high volumes of data, external data sources, and multiple joins by working in tandem with Data Warehouse solutions that optimize the relevant data sets for reporting.
Moreover, integrations need to go beyond pure visualization and have the ability to access transaction records so that users can benefit from end-to-end exploration of the NetSuite Data.
In light of this, it is best to work with a NetSuite Partner that can deliver this fully integrated experience right inside your Netsuite platform. Whether you're building reports or dashboards in Looker Studio, Power BI, Tableau or Domo, your data visualization tools are only as good as the data model that drives the visuals. When selecting the right NetSuite reporting tool, you need flexibility in your data visualization software.
This lets it adapt to your NetSuite segments and offers simple integration to other data sources.
Here is the breakdown of the top data visualization solutions that can support the NetSuite customer:
|
|
|
|
|
|
|
|
|
|
| Features | Data Studio | Looker | Power BI | Tableau | Domo | Qlik | Oracle Analytics Cloud | NetSuite SuiteAnalytics |
| Embedded Capabilities | ✔ | ✔ | ✔ | ✔ | ✔ | ✔ | ✔ | ✖ |
| Small & Medium Business Target | ✔ | ✔ | ✔ | ✔ | ✔ | ✖ | ✖ | ✔ |
| Support Multiple Data Sets | ✔ | ✔ | ✔ | ✔ | ✔ | ✔ | ✔ | ✖ |
| Support Multiple Data Warehouses | ✔ | ✔ | ✔ | ✔ | ✔ | ✔ | ✔ | ✖ |
| 100% Cloud-Based | ✔ | ✔ | ✖ | ✖ | ✔ | ✖ | ✔ | ✔ |
| NetSuite Connector | ✖ | ✔ | ✔ | ✔ | ✔ | ✔ | ✔ | ✖ |
| Google Native | ✔ | ✔ | ✖ | ✖ | ✖ | ✖ | ✔ | ✖ |
| Microsoft Native | ✖ | ✖ | ✔ | ✖ | ✖ | ✖ | ✖ | ✖ |
| Oracle Native | ✖ | ✖ | ✖ | ✖ | ✖ | ✖ | ✔ | ✔ |
While many excellent data visualization tools exist for the NetSuite ecosystem, selecting one should align with a broader, long-term Business Intelligence (BI) data strategy. As previously mentioned, data visualization serves as an initial step in expanding NetSuite's analytics capabilities.
To maximize the value of your NetSuite data, it's crucial to establish a scalable Business Intelligence System Architecture that can accommodate the potential complexity and volume of data analysis as your ERP data grows.
In light of this reality, GURUS Solutions has developed the Business Intelligence for NetSuite (BI4NetSuite), a NetSuite add-on solution that is designed specifically for the NetSuite community.
Carefully evaluating best-in-class BI Cloud solutions in line with NetSuite’s current architecture and business model, GURUS Business Intelligence combines Google Data Warehousing and Data Visualization available for consumption right inside the NetSuite Platform.
Moreover, the GURUS product team has invested its 20+ years of NetSuite expertise into an optimized data-model reworking dozens of NetSuite tables in the Google BigQuery Data Warehouse.
Optimized NetSuite data models simplify complex data structures, creating a robust BI architecture. This empowers business users to generate strategic reports by integrating data from their primary enterprise system and other relevant sources for informed decision-making.
To learn more on how GURUS Solutions can help you with your Data Visualization challenges, book a demo to see our BI4NetSuite tool in action.